-
Matter Home Energy Manager – First Milestone!
It’s been a busy few weeks, but I’ve managed to make steady progress on my Matter based Home Energy Manager, and I’ve finally reached the first major milestone: Displaying & recoding my grid consumption! It has taken quite a bit of foundation writing and experimenting, but it’s starting to coalesce… Read ⇢
-
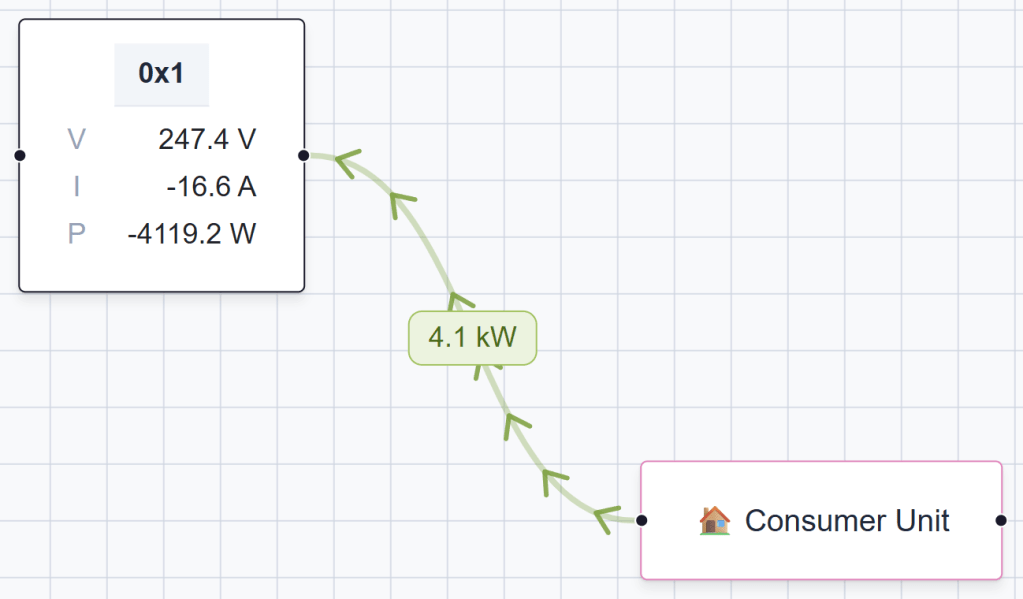
Building a Matter Meter Reference Point device for testing
I’ve finally started making progress with my Matter based Energy Manager UI. With the help of Claude Code, I even had a nice animation, showing power flowing. I was getting a sense for the how it might all hang together. My original goal was to use data from my Solax… Read ⇢
-
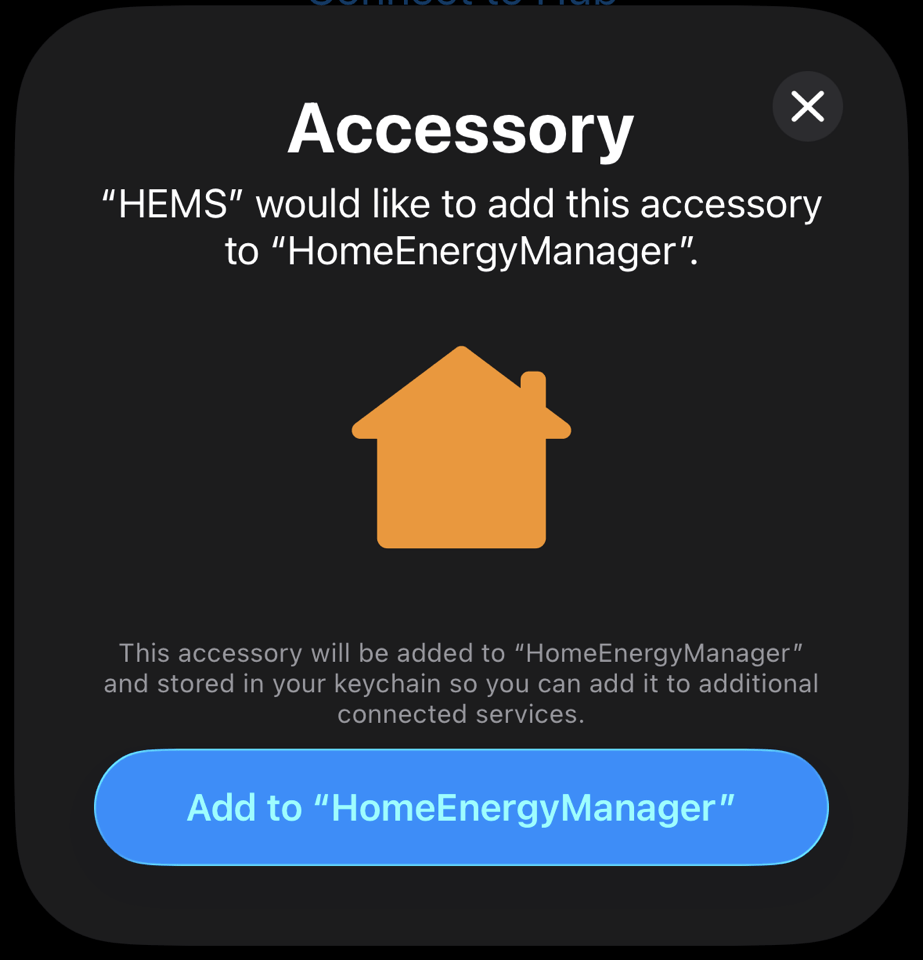
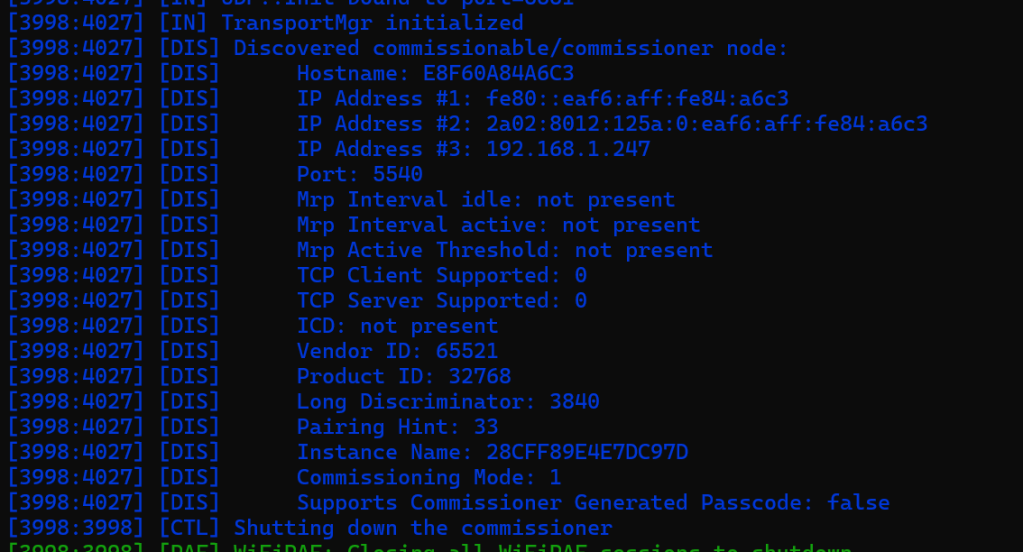
Building an ESP32 Matter Commissioner in SwiftUI
As part of my Home Energy Manager project, I realised that I would need a nice to connect my Matter devices to it. In Matter, adding a device is called commissioning and it’s typically done by scanning a QR code. The commissioner, in this case my Home Energy Manager, would… Read ⇢
-
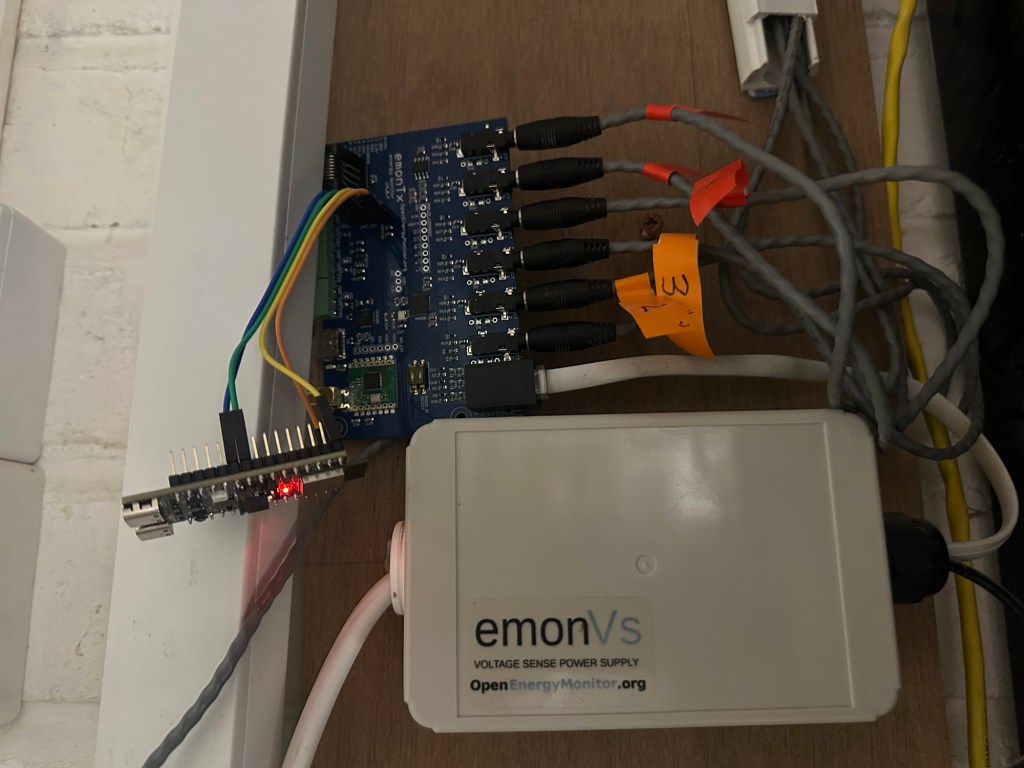
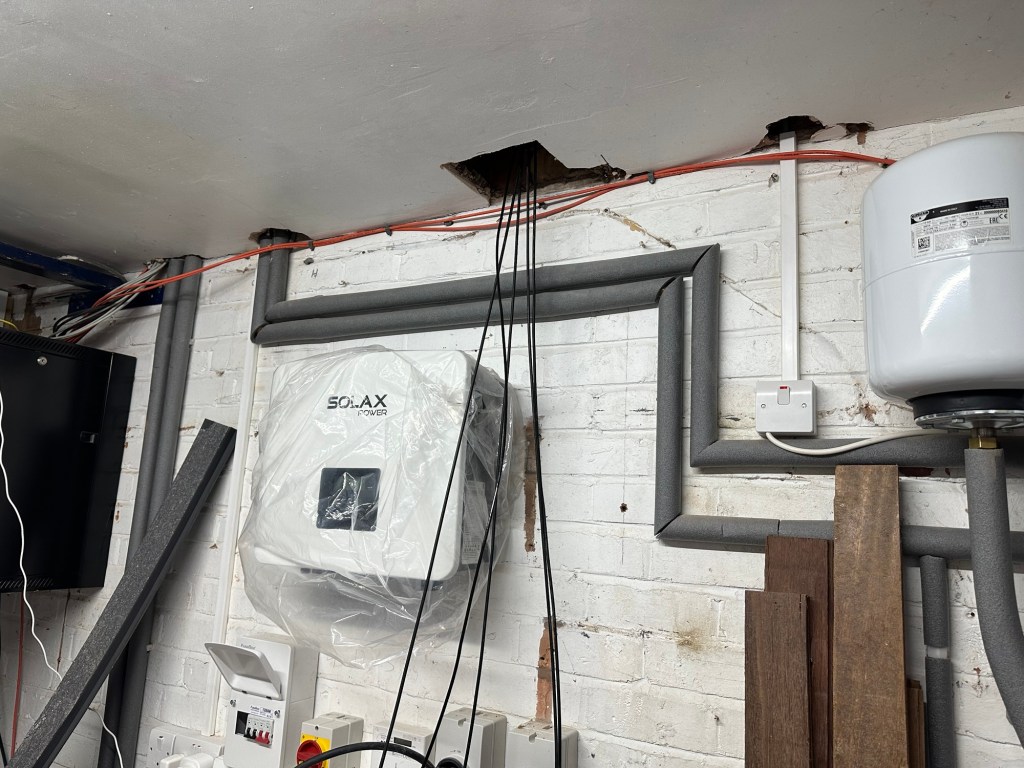
Integrating a Solax X1-G4 Inverter with Matter Protocol
In this post, I detail how I use Modbus TCP to read some basic information from my Solax X1-G4 inverter and expose it via the Matter smart home protocol. Why? Because ultimately, I want to expose my inverter via Matter, allowing me to add it to my Matter based home… Read ⇢
-
Building a Mad Men inspired intercom – the failed first attempt!
Even since I started working from home, I had this mad idea of installing intercoms across my house. It was mostly inspired by watching (and re-watching) of the TV show Mad Men! All of the main characters had their own intercom for being buzzed or asking their secretary for coffee.… Read ⇢

-
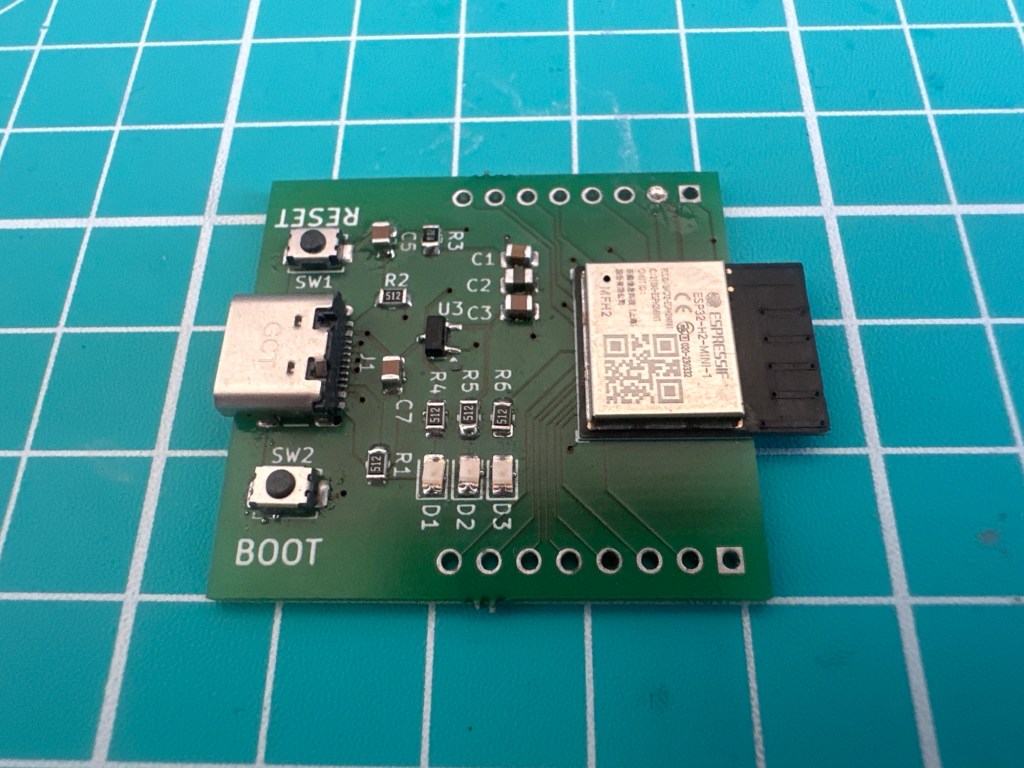
My first attempt at building an ESP32-H2-MINI-1 PCB didn’t go to plan!
This is the first ESP32 PCB I’ve designed. Hot on the heels of my nRF54L15 devkit, I decided to give the ESP32-H2-MINI-1 a go. I wanted to push myself, by designing something a little more complicated. This board featured the small ESP32-H2-MINI-1 module, two buttons, three LEDs and a USB-C… Read ⇢
-
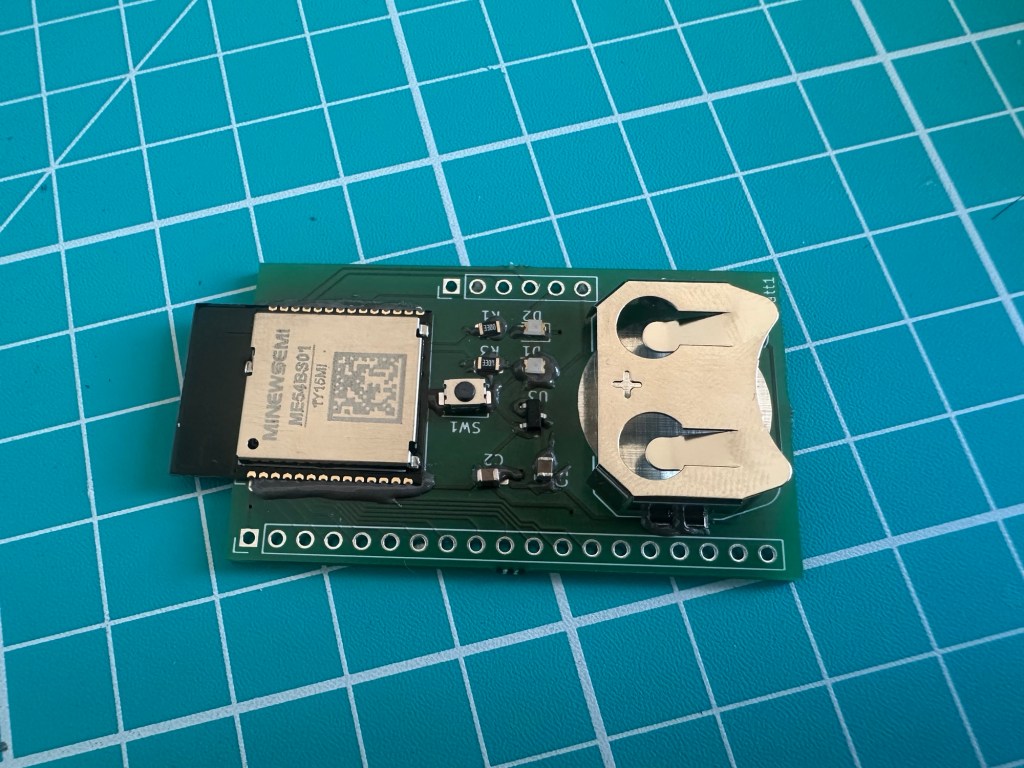
Assembling and flashing my custom nRF54L15 board
A few weeks ago, I designed a simple breakout board for the MinewSemi ME54B01 module. Whilst I had one of the DevKits, I wanted to go through the exercise of designing my own PCB, with a battery compartment. I used KiCad to do the schematic and PCB layout and after… Read ⇢
-
ESP-Matter: On Network commissioning of an ESP32-S3-ETH
As I’m building out an ethernet based Matter device, I wanted to get something called On Network Commissioning up and running. In this post, I’ll explore what steps I need to take in order to enable it on a Waveshare ESP32-S3-ETH devkit. What is On-Network commissioning? When you commission a… Read ⇢
-
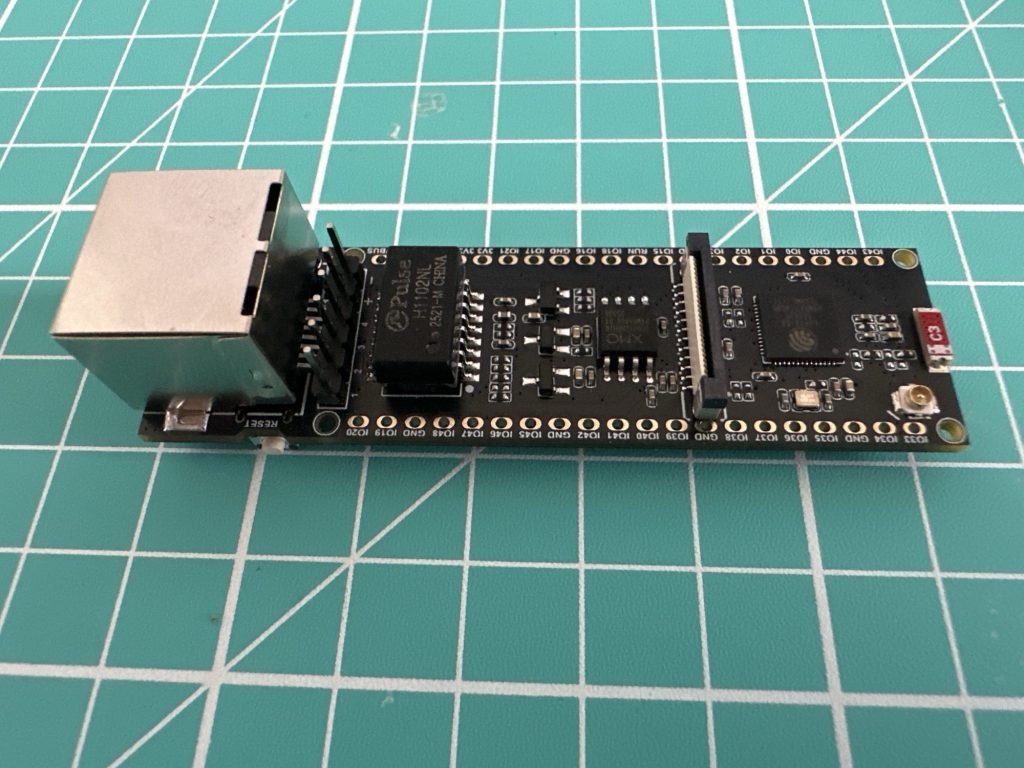
ESP-IDF SDK: Setting Up Ethernet on ESP32-S3-ETH Devkit
Below is a photo of a Waveshare ESP32-S3-ETH DevKit. In this blog post, I’m going to look at what’s involved in connecting this board to my local network using the ESP-IDF SDK. As the name suggests, it features an ESP32-S3 and an Ethernet RJ45 connector. It also has a camera… Read ⇢