Since I started work on my Dual Temperature Sensors, I’ve had lots of issues with connectivity between the sensor and the their controller.
Be it with Bluetooth, Bluetooth Mesh, Zigbee or now, Thread.
I published a post recently where I dug down into my Thread Network to understand why sensors stopped sending measurements. I made great progress with my diagnosis and finding the cause was my WiFi network! I eventually creating a new Thread network, which appeared much more stable.
With my network apparently fixed, I put all ten sensors into position. I unplugged my S3 from my PC and put it onto a wall mounted charger (so it would stay active!).
After checking this morning, two of the sensors were disconnected 😦
Why haven’t they reconnected?
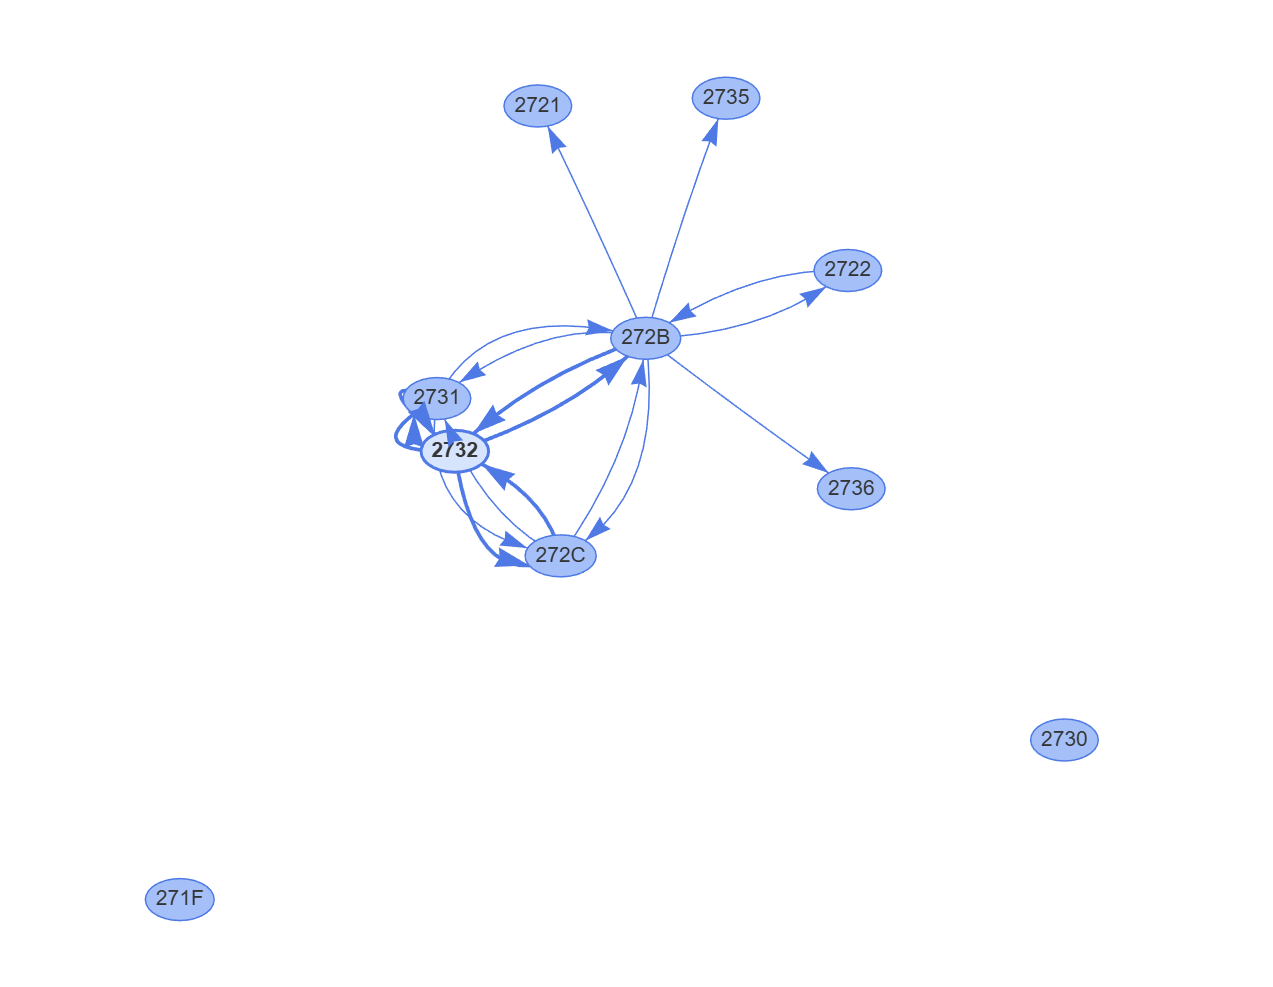
My Battery sensors are called ICDs or Intermittent Connected Devices. These are a type of Matter device that spend their time asleep, saving battery power.
If they don’t have any Matter subscriptions, they will “Check-In” with their controller periodically, giving the controller a chance to respond.
This seems to work *pretty* well, as we can see above. Of the six battery devices, my controller reconnected to four and established a subscription.
The obvious question was why didn’t the other two “Check-In” and receive new subscriptions?
Was my Thread Network still acting up?
Visualizing the Network
After my Thread deep dive and the addition of the Thread Network Diagnostics Cluster, I figured it might be possible to visualize my network.
My ICD devices wouldn’t respond to any requests in a timely fashion, but I had several Wired devices in network too. These devices are mains powered (via USB) and can act as Routers in my Thread network. I had a few of them around the house to ensure broad coverage!
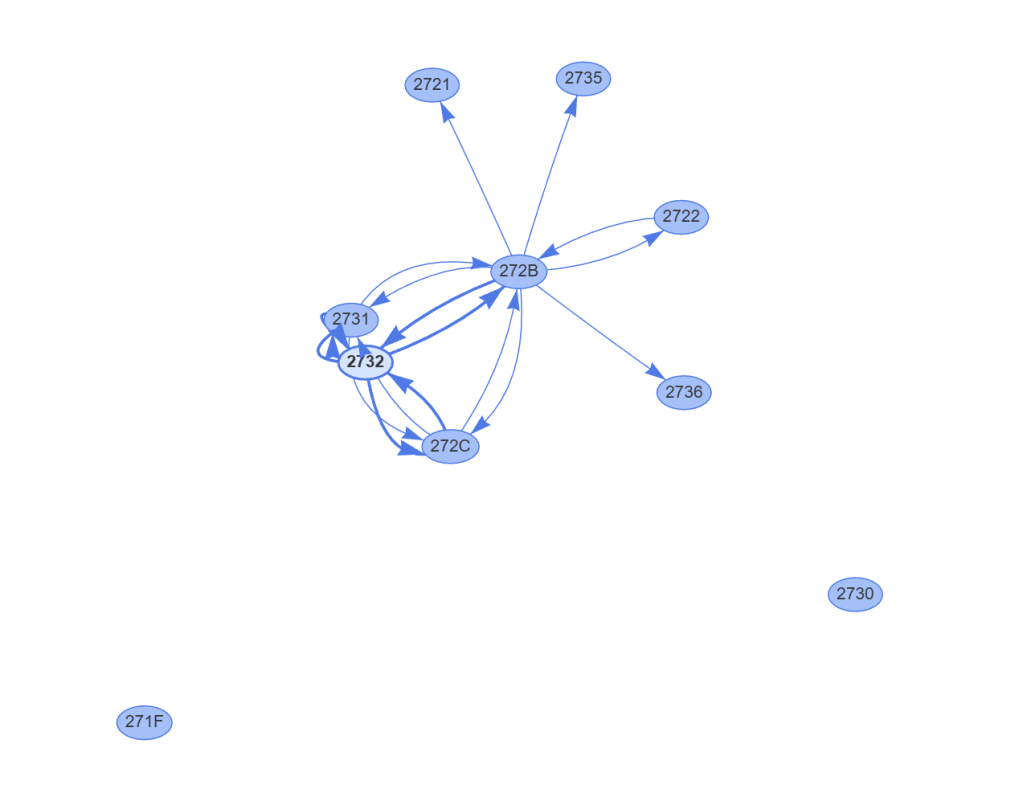
After some tinkering with vis-network, a populate graphing library, I could see my graph. If would start by pulling down the list of nodes and then querying the NeighborTables for the wired nodes.
The two little nodes at the bottom, 2730 and 271F, didn’t appear connected at all. However, the lack of arrows didn’t mean they weren’t connected. My Thread network also includes an Open Thread Border Router and a Nanoleaf Thread bulb. Neither the OTBR nor the bulb would be visible to my Controller, so 271F and 2730 could be connected via those.
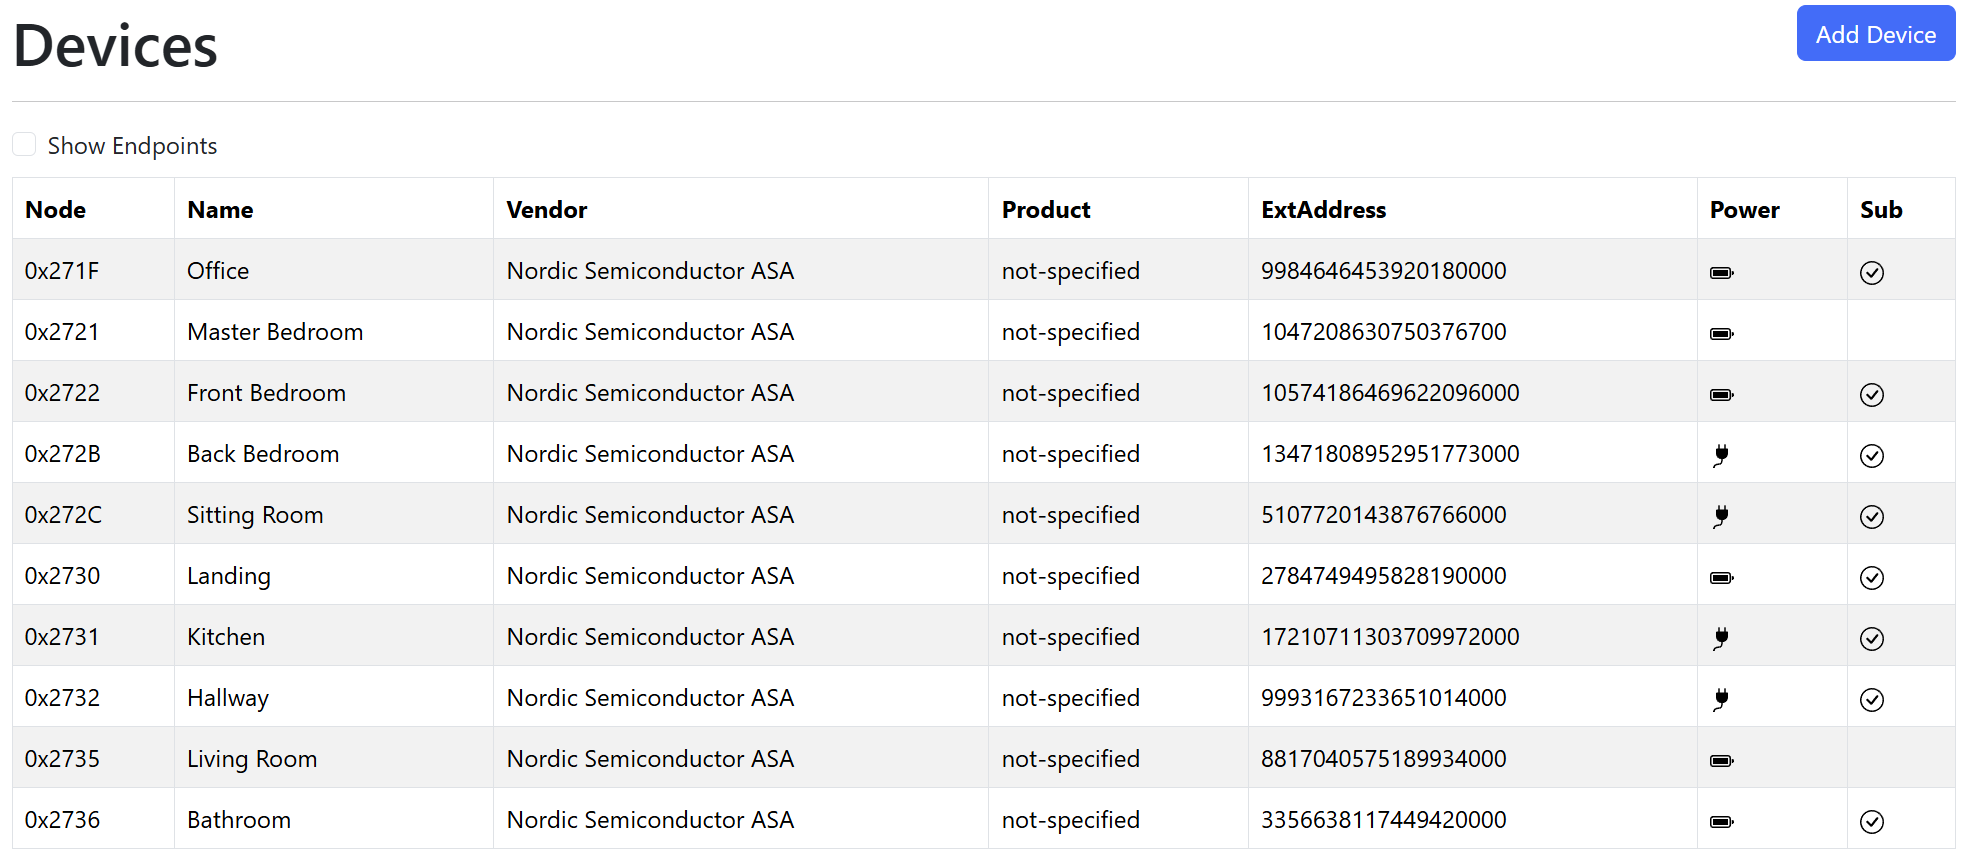
Those devices *would* appear in the NeighborTables, so I reworked my approach to add points for nodes that weren’t devices.
The graph started showing two circles, which represented nodes in the Thread network that weren’t devices the controller knew about. They were the Open Thread Border Router and the Nanoleaf bulb.
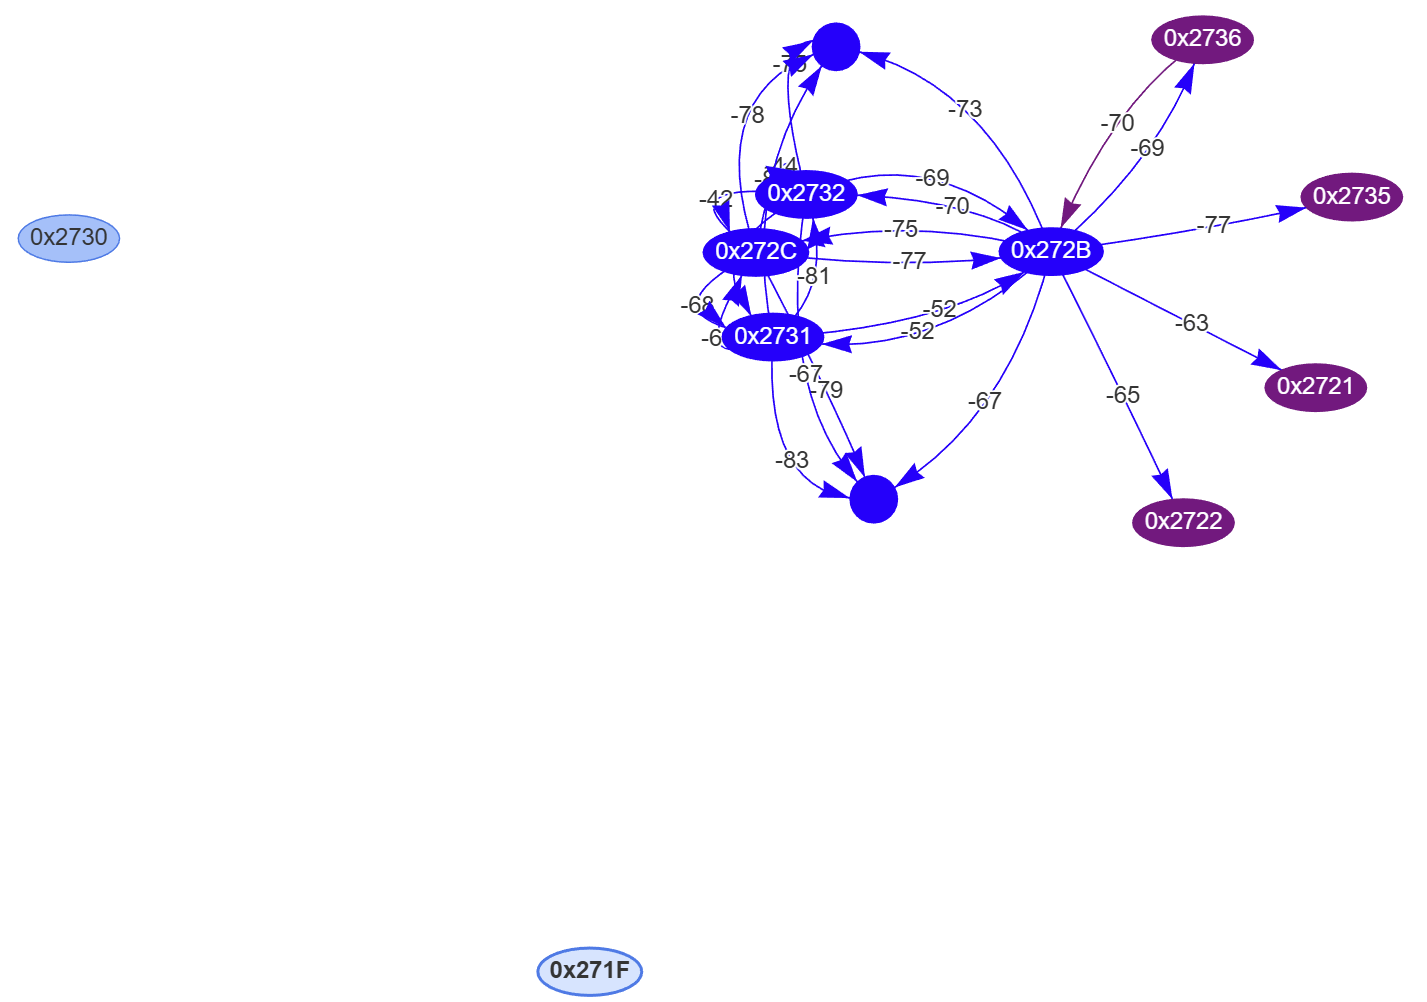
The Thread Network looked good
Now I could see everything was essentially connected, I was left even more confused. Nodes 0x271F and 0x2730 seemed like an issue, but both of these devices reconnected.


The two devices that couldn’t reconnect, 0x2721 and 0x2735, seems like they had strong connections. RSSI values showed as -63 and -77, well within acceptable limits.
If we take 0x2721, it’s on the NeighborTable of 0x272B. The RSSI is good, so there should be no RF issues.
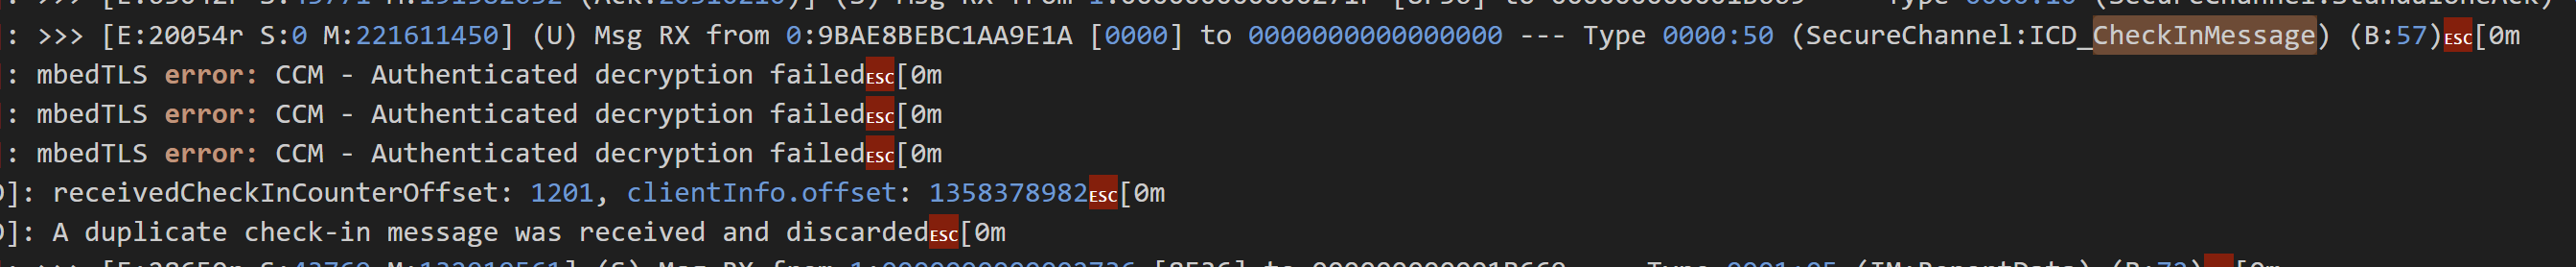
I disconnected the battery from 2721 and reconnected it. In my Controller, a CheckInMessage was logged, but it had a strange message – “A duplicate check-in message was received and discarded”

I repeated the process and the same message

Did it a third time and got the same result again

I checked the code responsible for this error message and it looked like it was comparing counters.
// Detect duplicate check-in messages and return CHIP_NO_ERROR on receiving a duplicate messageif (receivedCheckInCounterOffset <= clientInfo.offset){ ChipLogError(ICD, "A duplicate check-in message was received and discarded"); return CHIP_NO_ERROR;}
The ICD check-in message must include a counter of some sort. I then remembered that I’d seen counters in some logging. When my controller starts, it dumps all the known ICD data to the logs. This table shows the node, the check-in target, a start count, an offset count and a subject.
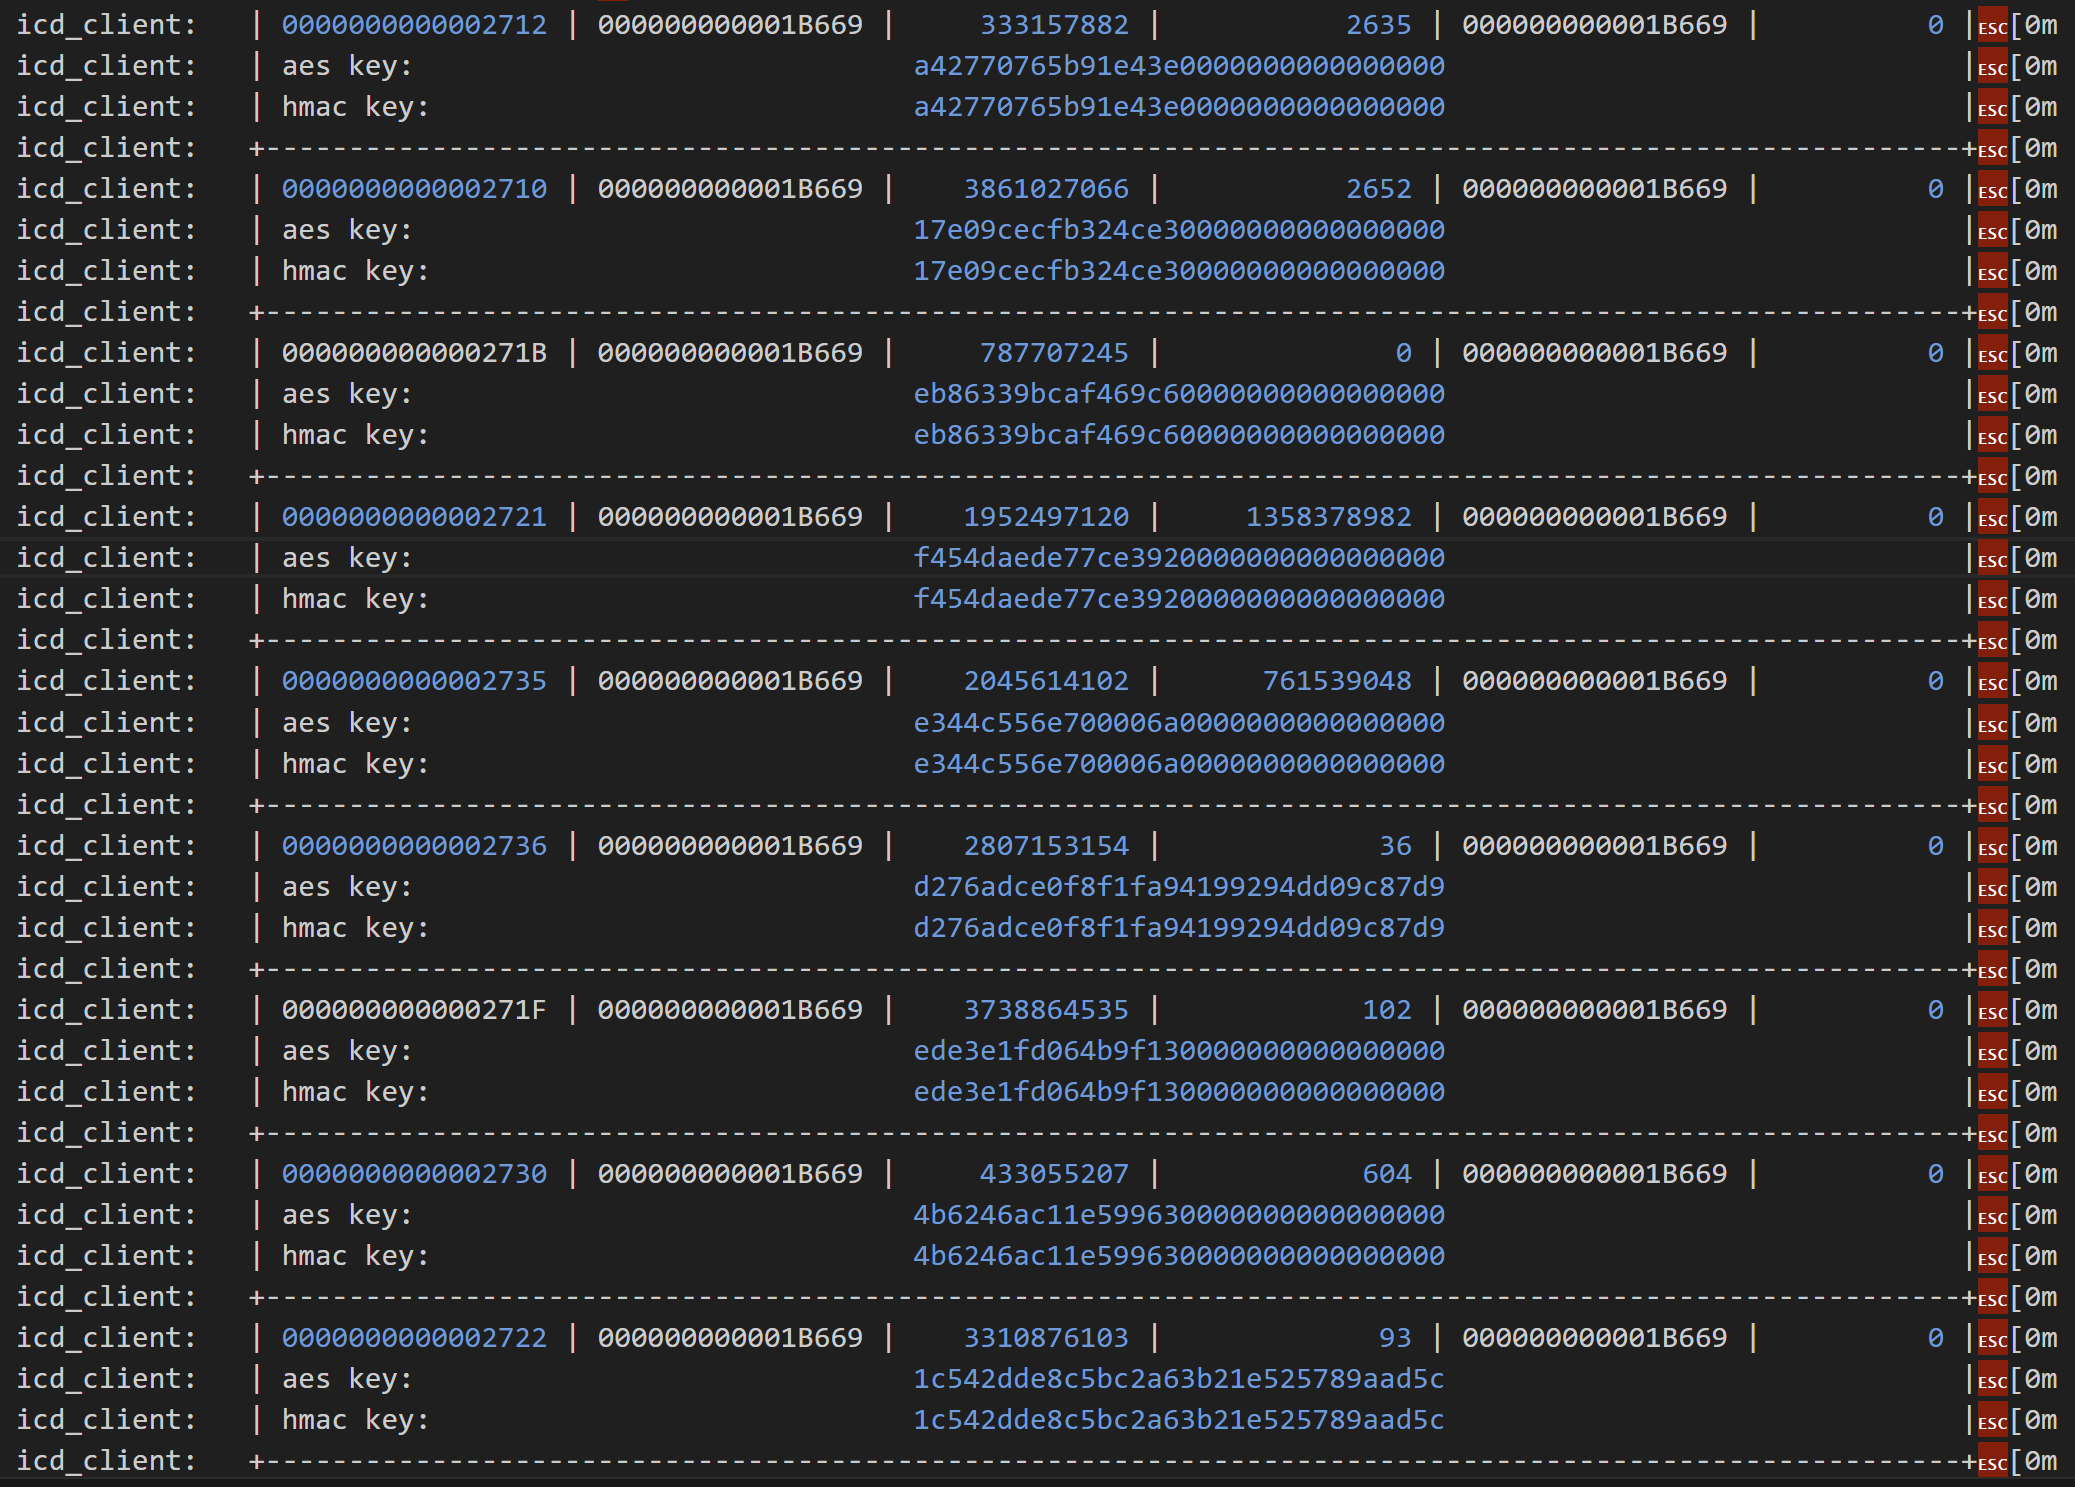
Immediately I spotted something strange. The two devices that were problematic has massive didn’t want to connect has huge offset counts compared to other devices.
Look at 0x2721, the fourth entry in the table. The offset count is 1358378982. Compare that to another working node, like 2722, which has a count of only 93!!! From that number, my device had checked-in over a billion times. If my device checked-in once a second, it would take more than 30 years to reach that number! I smelled a bug.
Sure enough, my logging confirmed that the check-in counter values were rubbish.

On cycling my device, it tried to check-in with a count of 1101 and got rejected. I cycled the power again
The counter had jumped by 100 to 1201, but was still rejected.
To reach the massive 1.3 billion number needed for a valid check-in, I’d only need to cycle the power a 1.1 million times 🤣
Solving the problem
The obvious solution was to remove the device from my controller and simply commission it again. That would establish a new ICD record with the correct counter. My problem with this approach is that it might happen again. I didn’t understand how the counter went wrong, which meant it could go wrong again.
I wondered if there might be a way to simply change the counter value and let the standard check-in process carry on.
I took a look through the ICD code and came upon the DefaultICDClientStorage class, responsible for storing the ICD Info. I could see it was possible to iterate and update individual entries. I quickly wrote up a DELETE API that did just that, setting the offset to zero.
app::DefaultICDClientStorage::ICDClientInfoIteratorWrapper wrapper(iter);app::ICDClientInfo info;while (iter->Next(info)) { // Find the matching record if(node_id == info.peer_node.GetNodeId()) { ESP_LOGI(TAG, "Found the ICD record for node %llu. Resetting offset...", node_id); info.offset = 0; icd_client_storage.StoreEntry(info); }}
I executed this against node 0x2721…

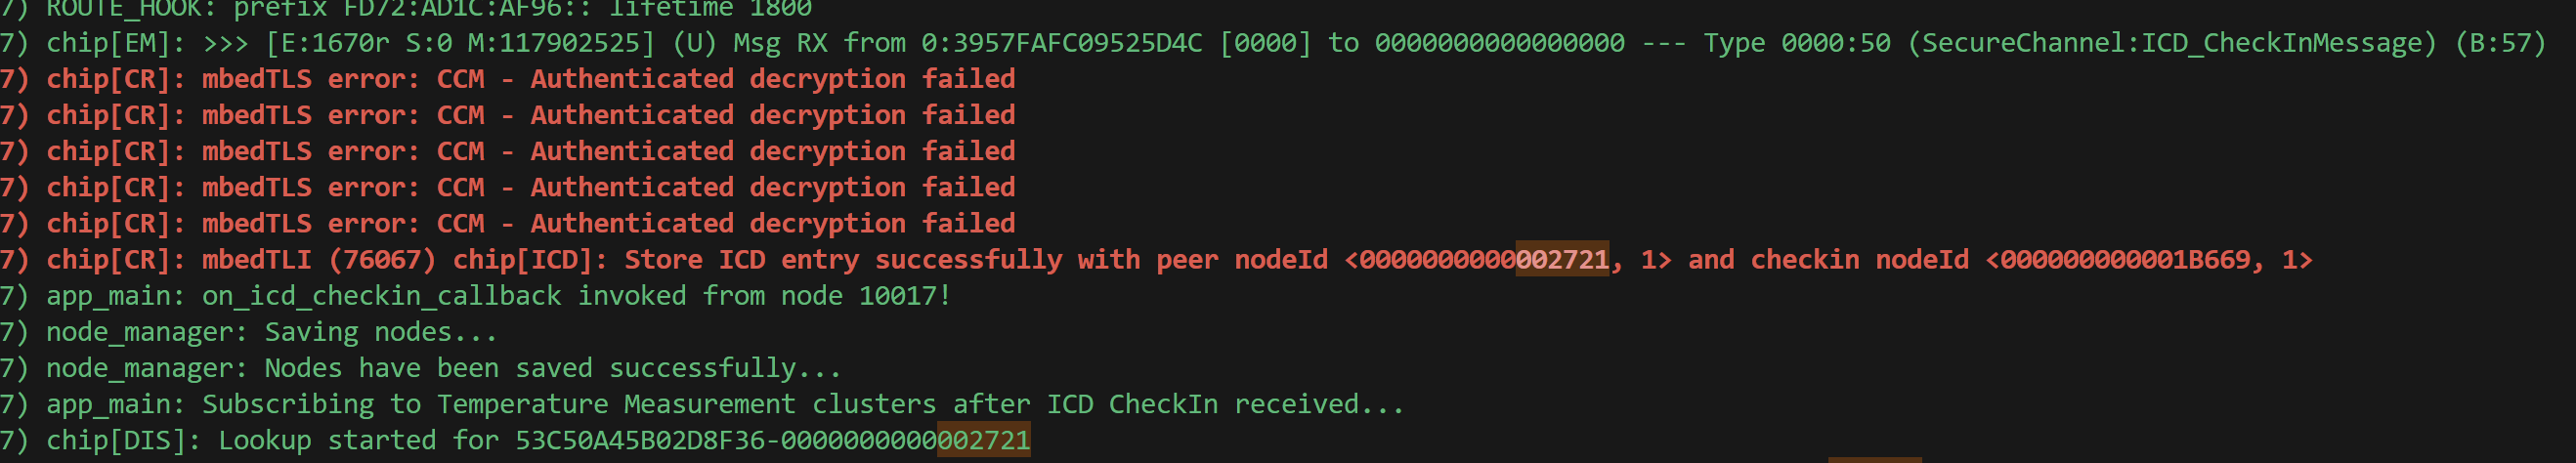
From the logs, it appeared to work. I could see indications the updated node was stored.
I then cycled the power in the device and lo-and-behold, it accepted the check-in! The CheckInMessage was received and processed and then a subscription request was sent.
It wasn’t processed quite as I expected it, since I didn’t seem my counter logging. Perhaps the zero counter caused a different flow?
What did matter (no pun intended!) – my device was subscribed to!
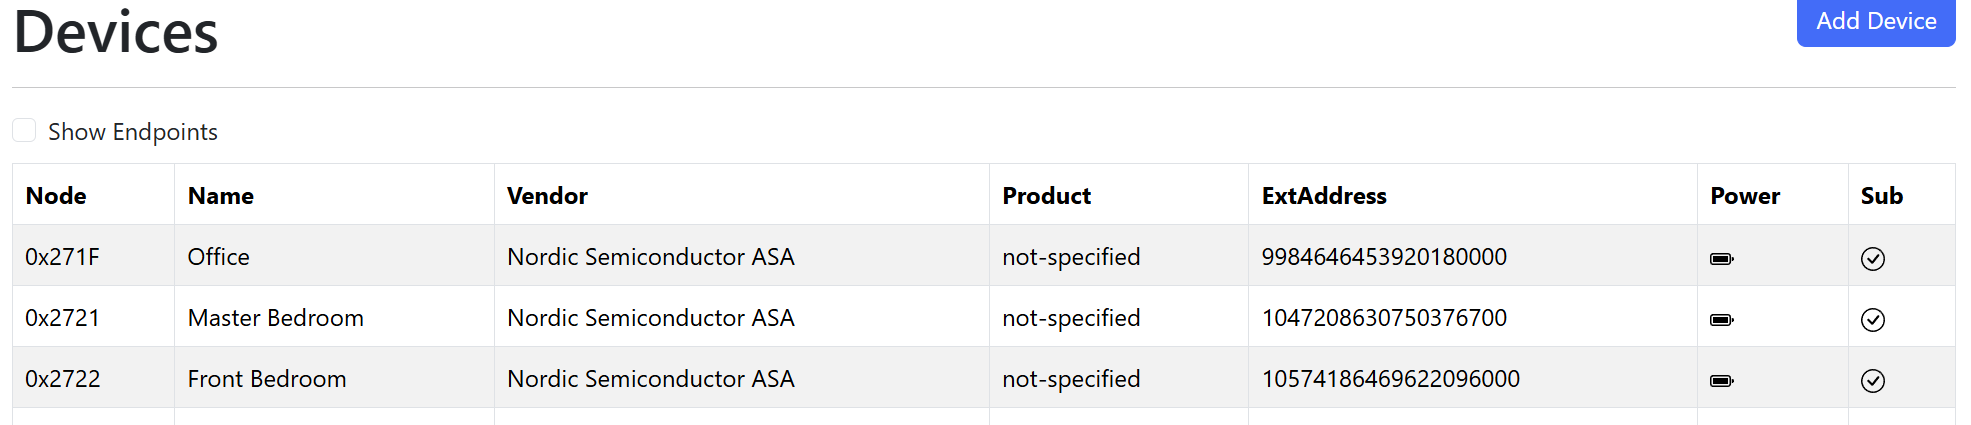
I repeated the process for 0x2735 and just like that, all ten sensors were connected!

Just in time for the weather to get warm so I no longer need the heating 😶
Summary
In this post, I dug into why two of my battery powered sensors wouldn’t connect to my controller.
After building a simple tool to visualize my Thread network and ruling out RF issues, I found the problem was in the ICD registrations. The counter offset stored in my controller was completely out of sync with the one in the device.
After resetting the offset values to zero for both of the devices, they happily reconnected!
This was an interesting deep dive as I learned a little more about ICD and how it’s implemented. I’m beginning to understand why people complain about their battery devices dropping offline. For me, I could rectify the issue as I owned the controller. If I was using another controller, the only solution would be re-commissioning the device.
Thankfully all of my sensors are now connected and sending readings!
Did you like reading this post?
If you found this blog post useful and want to say thanks, you’re welcome to buy me a coffee. Better yet, why not subscribe to my Patreon so I can continue making tinkering and sharing.
Be sure to check out my YouTube Channel too – https://youtube.com/tomasmcguinness
Thanks, Tom!

Leave a comment