
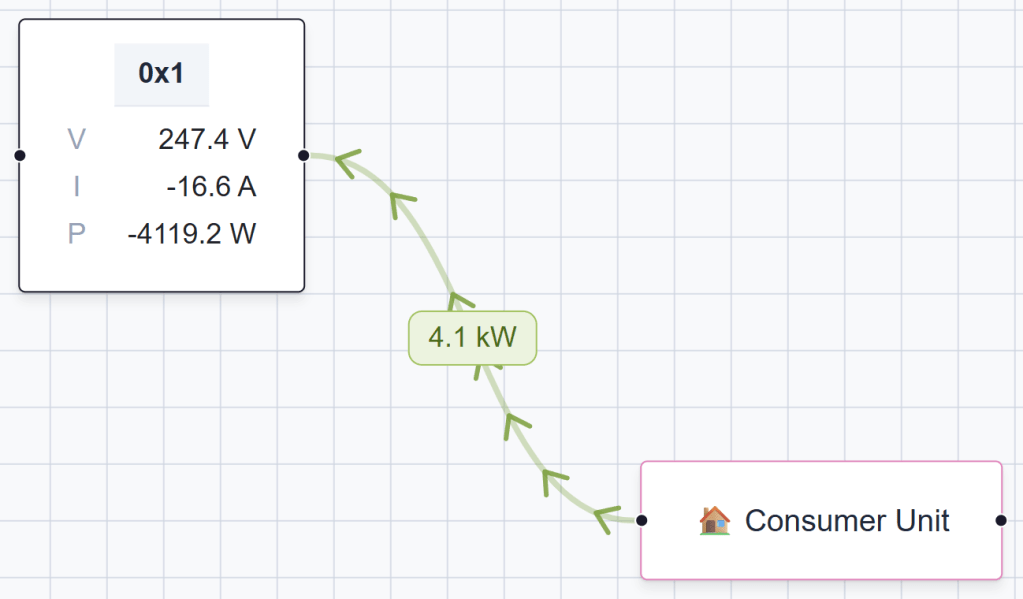
It’s been a busy few weeks, but I’ve managed to make steady progress on my Matter based Home Energy Manager, and I’ve finally reached the first major milestone: Displaying & recoding my grid consumption!
It has taken quite a bit of foundation writing and experimenting, but it’s starting to coalesce into something! I have some long-term goals for this project, but for now, I’m just trying to build some basic functionality.
My home energy manager is running on an ESP32 P4 DevKit and it hosts a web application. It’s built with the Espressif Matter SDK.
Basic Setup
The home screen looks like this. It has slots for inputs, shows the consumer unit, and has slots for appliances.
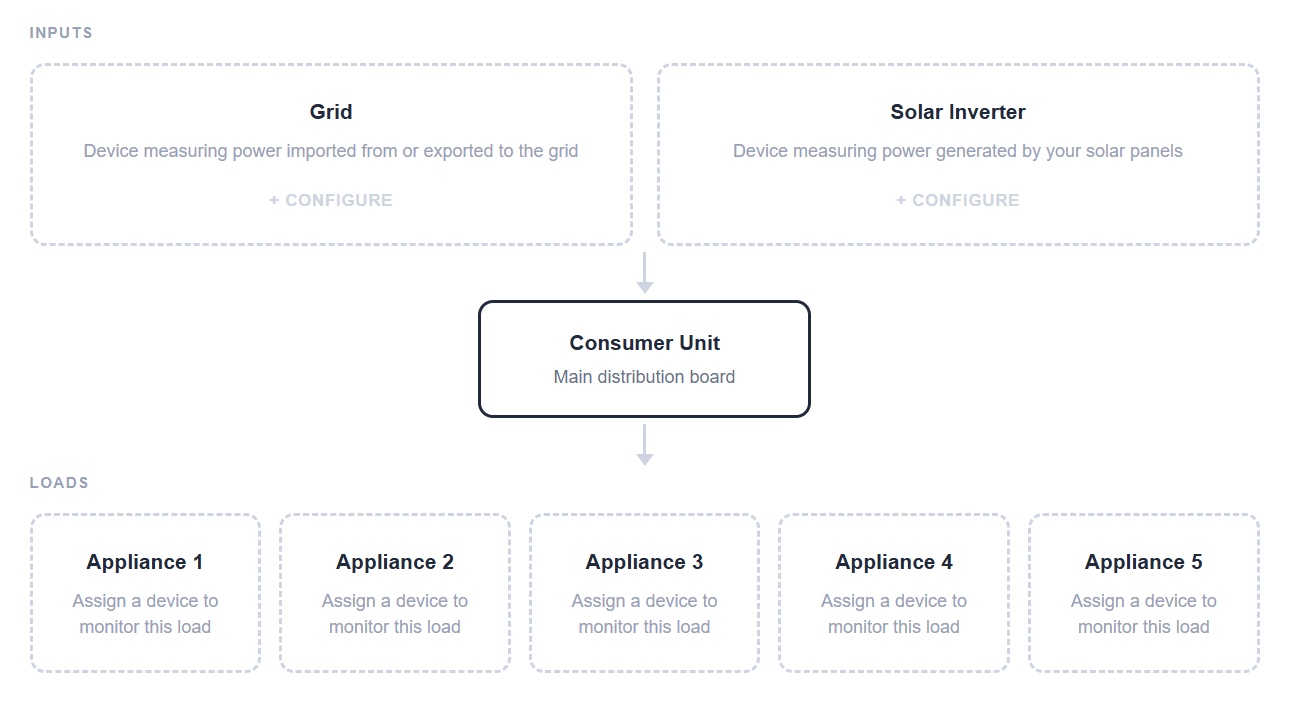
This screen is mostly aspirational at this time, with only the grid slot being configurable. The idea is that I can guide a user along, allowing them to populate the slots with various Matter devices. In the case of the grid slot, they can choose an Electrical Sensor.
For me, a lifetime Shelly fan, I chose a Shelly EM Gen 4 as my electrical sensor!
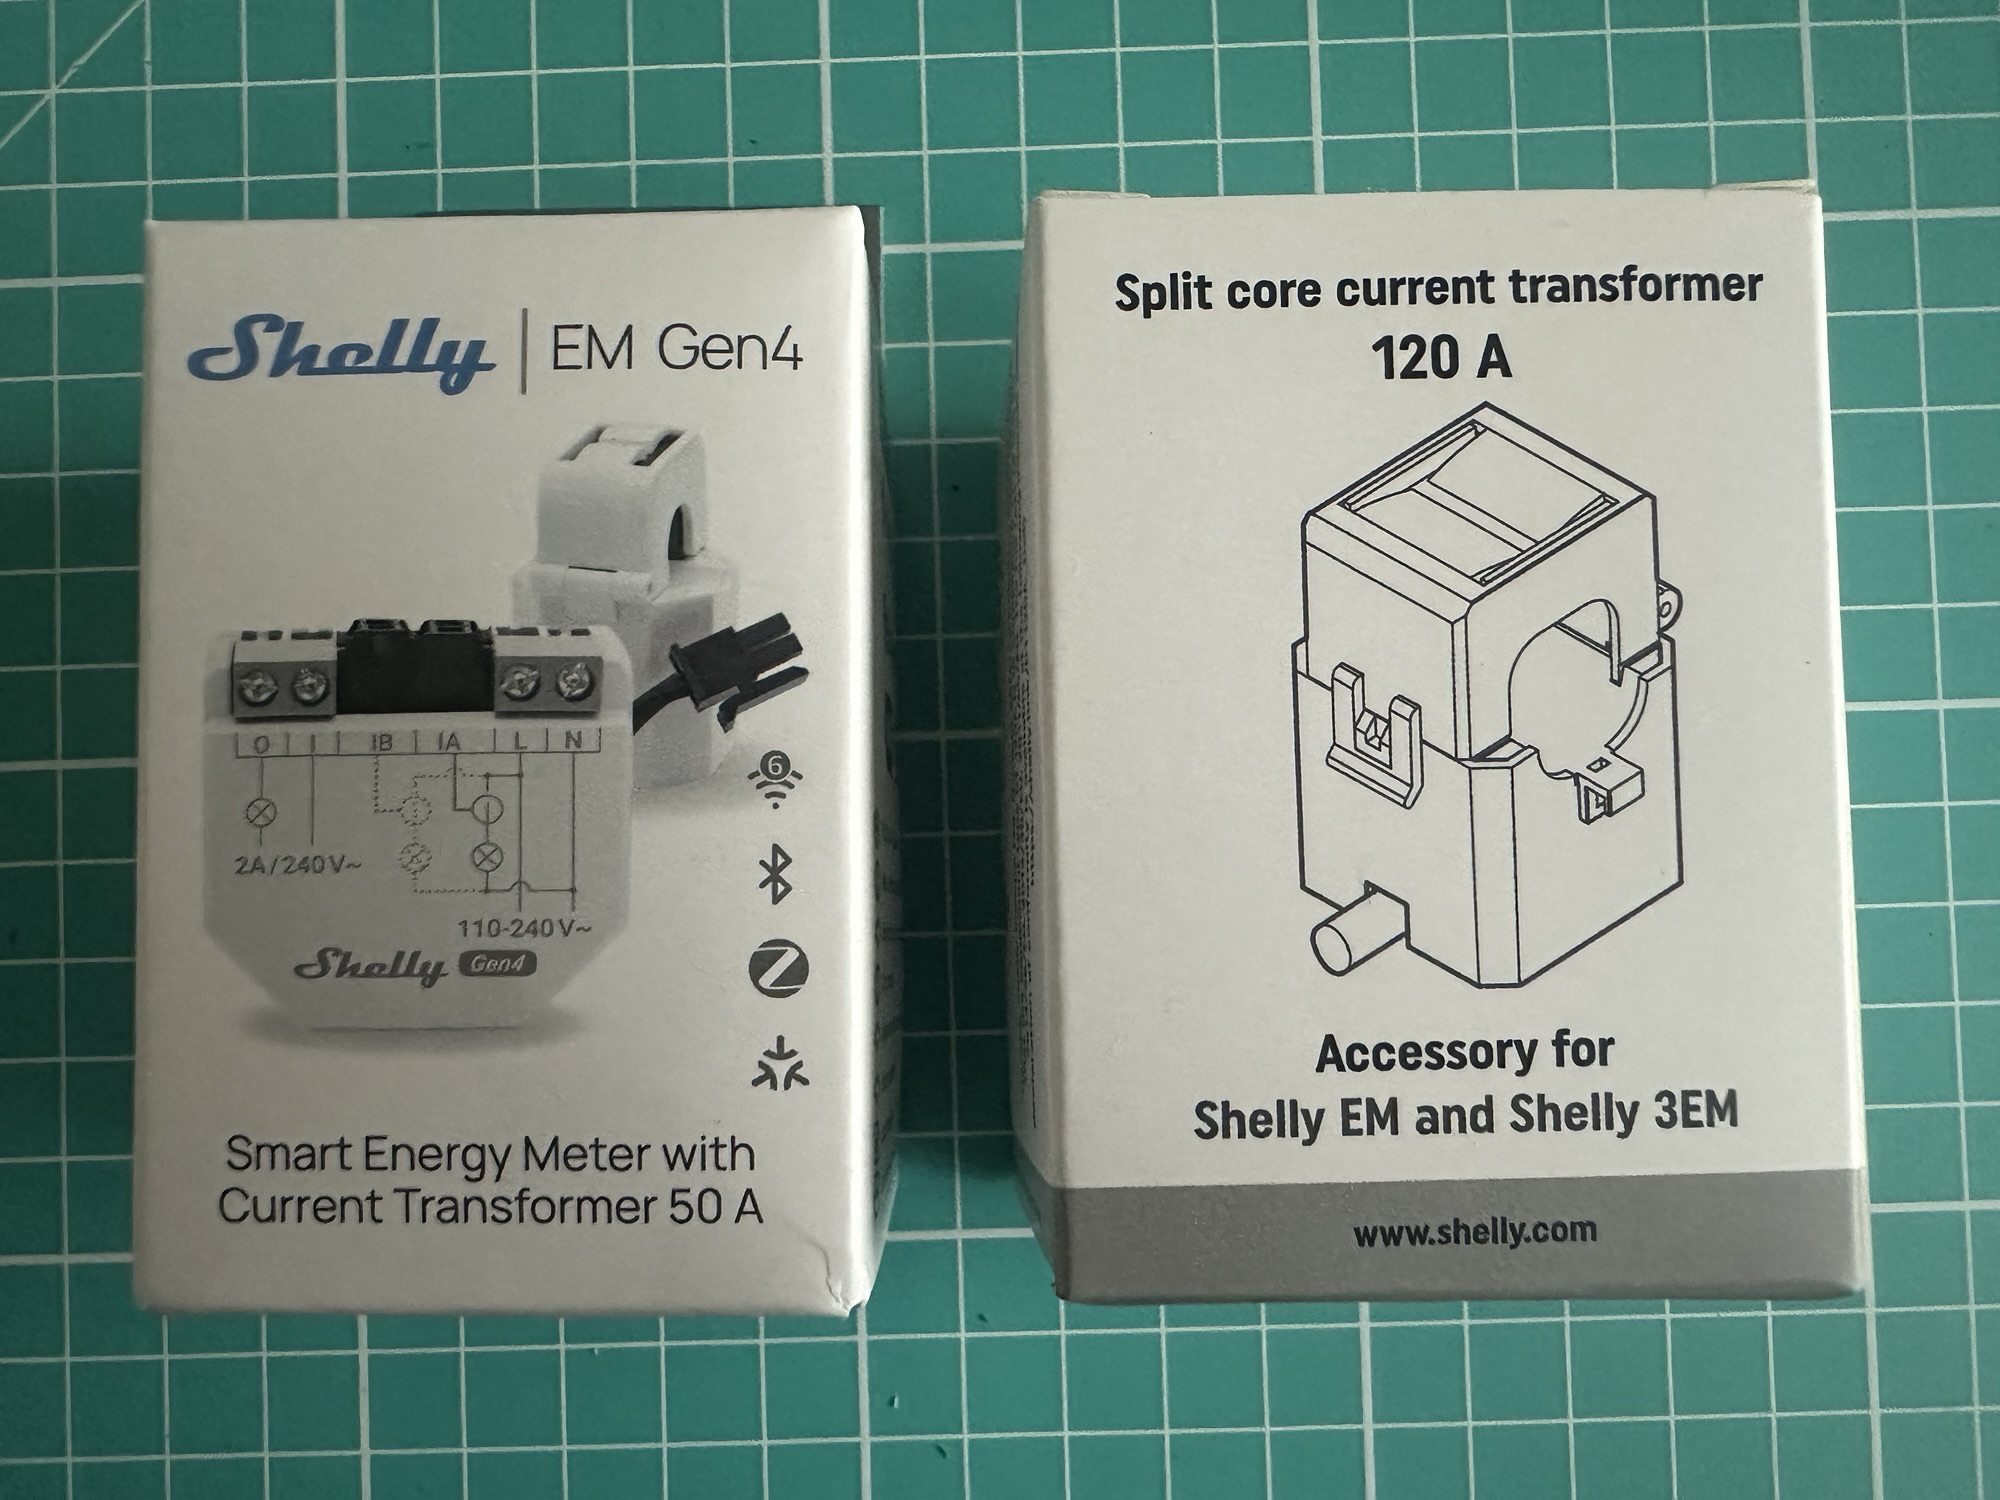
Release in 2025, this is the 4th generation of the popular Shelly EM device. This device supports WiFi, Zigbee and Matter, making it an ideal choice. I already have a 1st generation Shelly EM monitoring my electricity, but it’s lacking Matter support (and cannot be upgraded). I purchased an addition 120A clamp to ensure my entire supply can be monitoring (it’s 100A).
Now, it turns out I purchased the wrong CT Clamp (!!!) and had to wait for a replacement, but once it arrived, I set it up on the live tail between the main fuse and the electricity meter.
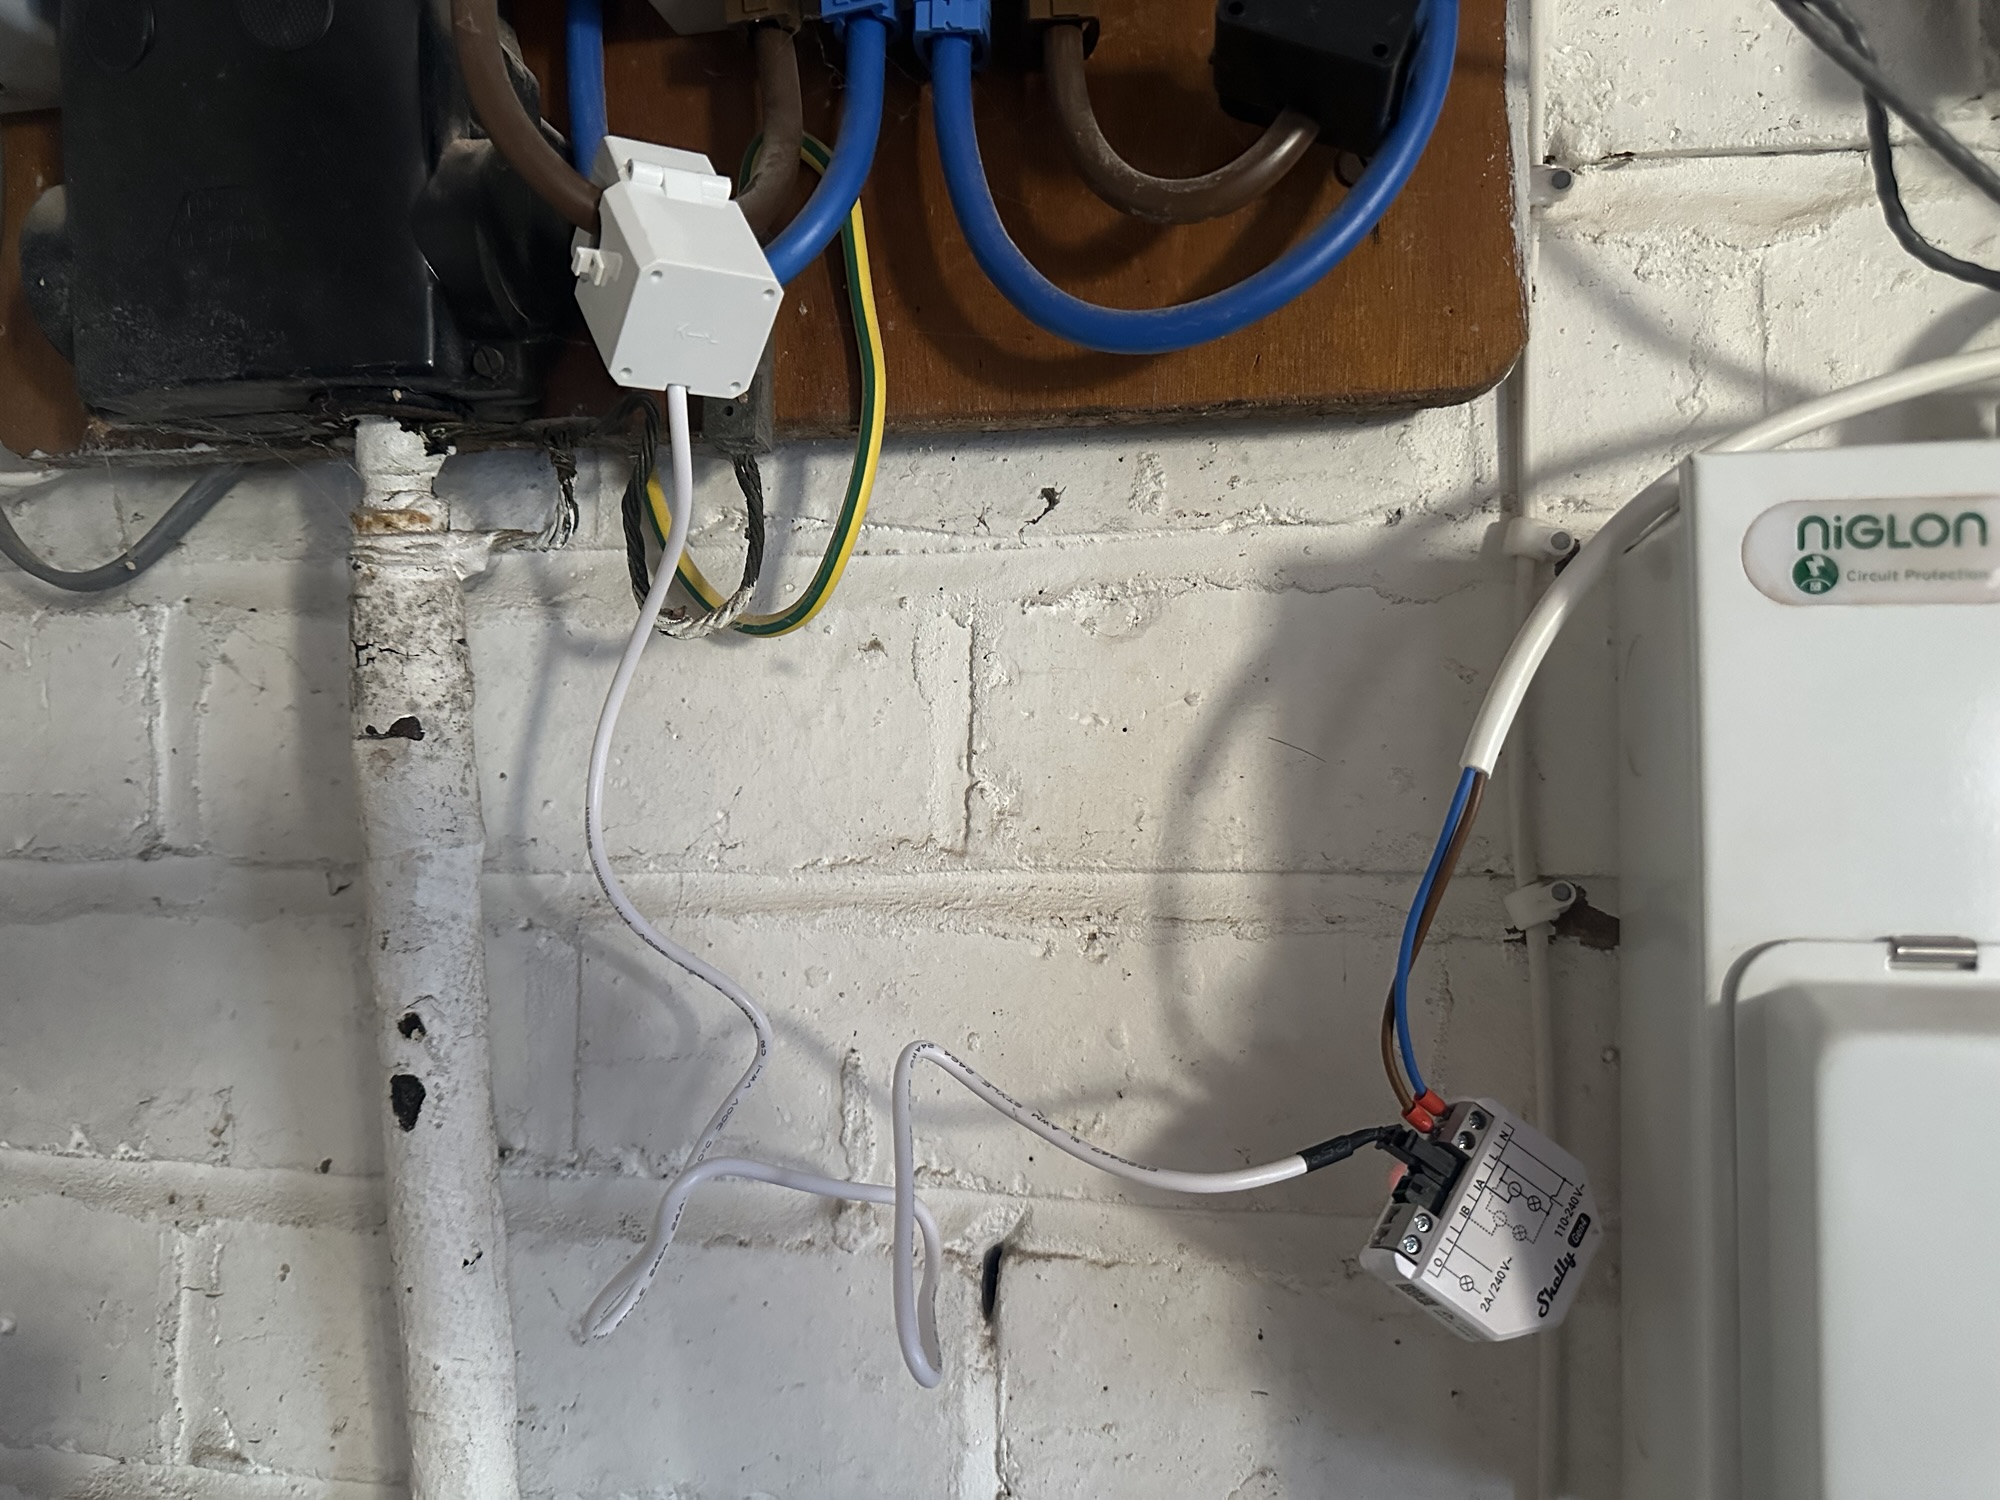
With the CT Clamp in position, I used my Companion App to commission it, pairing it with my HEMS. Aside from some Attestation issues, I needed to fix, the commissioning worked. My code then parsed its structure pretty well.
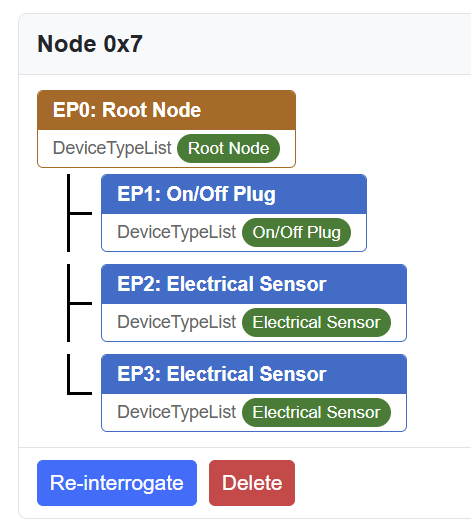
There is a relay onboard the EM, covered by Endpoint 1. The two CT clamps are then covered by EP2 and EP3.
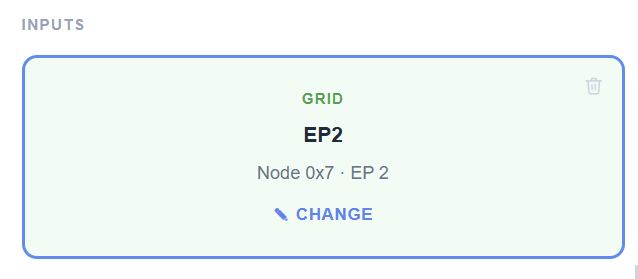
Under the Grid Slot on my inputs page, I selected Node 0x07, EP2.
Power!
This automatically updated the topology and it showed the power flowing between the nodes! Here is a little video I recorded:
The Grid wattage being reported is *tiny* since the battery was powering the house at the time.
My voltage and current readings aren’t working at present, but you can see the Power value.
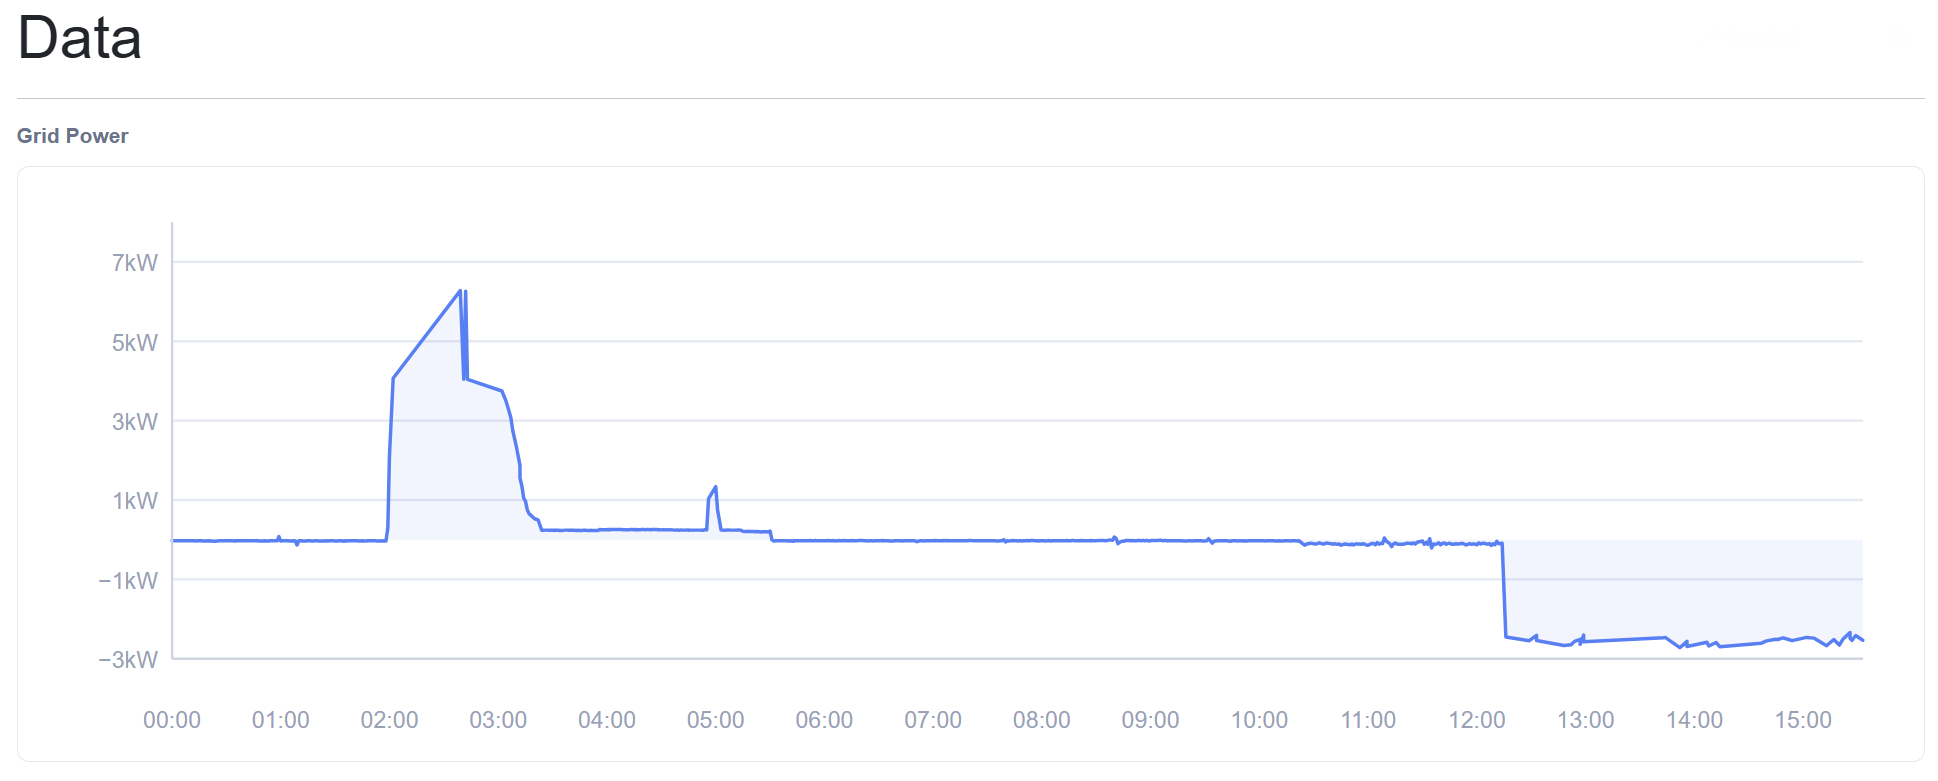
After it was left working over-night, my data recording showed a reasonable graph! You can see the spike in the morning as the grid charges the battery and then, just after noon, the graph flips showing power being exported!
Next Steps
Now that I’m recording my grid power, via Matter, I can focus on the next Milestone, which is supporting of a solar forecast.
Once I support a Solar Forecast, I can start to model the relationship between the grid power and the forecast. This will, I’m hoping, enable me to predict *when* there will be surplus power. My goal is to use small displays dotted around the house to nudge our behaviour to take advantage of the free power.
If you want to follow this project, be sure to subscribe!
Did you enjoy this post?
If you found this blog post useful and want to say thanks, you’re welcome to buy me a coffee.
Be sure to check out my YouTube Channel too – https://youtube.com/tomasmcguinness
Thanks,
Tom!

Leave a comment