During the development of my Dual Temperature sensor, an issue I ran into early on was connectivity.
I would commission the device whilst sat at my desk before moving it to its final position. My Heating Monitor controller would then lose touch with the device, and it would stop reporting temperatures. This happened whether my device was battery or mains powered. Once it “dropped off”, I couldn’t establish a Matter subscription again. The Matter messages just timed out.
I could see the device’s Matter record in the iOS Discovery app, and I could even ping its IP address.
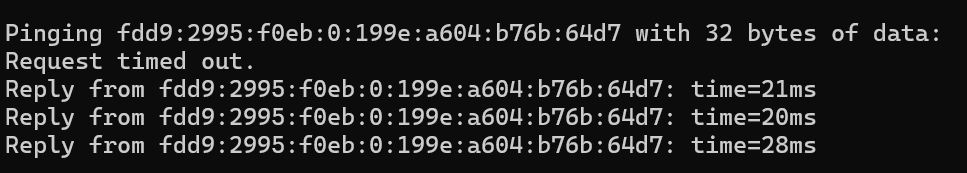
Not all pings would get a reply, which made me think there may be some networking issues at play. If small 32-byte payloads were getting dropped, the larger Matter payloads had no hope.
In the case of my battery powered devices, they could “Check-In”, but my Heating Monitor wouldn’t be able to respond. All attempts just timed out. As the “Check-In” payloads (ICD) are small, this reinforced my belief that the issue was network related.
I didn’t think coverage was the cause as I had 4 HomePod Minis, an Apple TV and an Aqara M200. These were all in the same Thread network and spread across my home.
This stability was preventing me from putting the sensors on my radiators, so I decided to dig a little deeper.
Moar Power!
I began by upping the transmission power of the device. This involved cranking up the TX Power to 8dBm, which is the max supported by the nRF54L15.
CONFIG_OPENTHREAD_DEFAULT_TX_POWER=8
This didn’t have any impact. After re-flashing and deploying, the sensors either never came online or eventually went “offline”.
Antenna and Voltage
I then returned to the nRF54L module’s datasheet, so see if there were any pearls of wisdom that could help. I came across this gem.
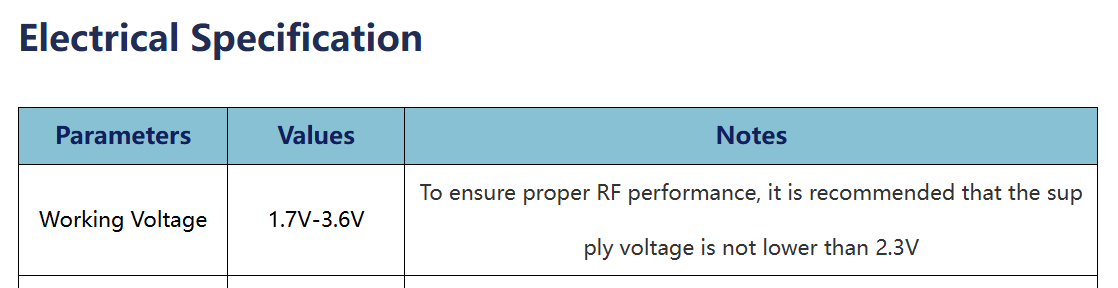
This was a potential problem. I was using 2.2V to power my modules, which was too low.
I ordered some 2.5V LDOs and used my last Minewsemi module. I attached a proper 2.4GHz antenna (from an ESP32-C6) and prepared to test it.
Before moving it, I decided to make a change to the sensor’s firmware – adding a Thread Network Diagnostics Cluster.
Thread Network Diagnostics
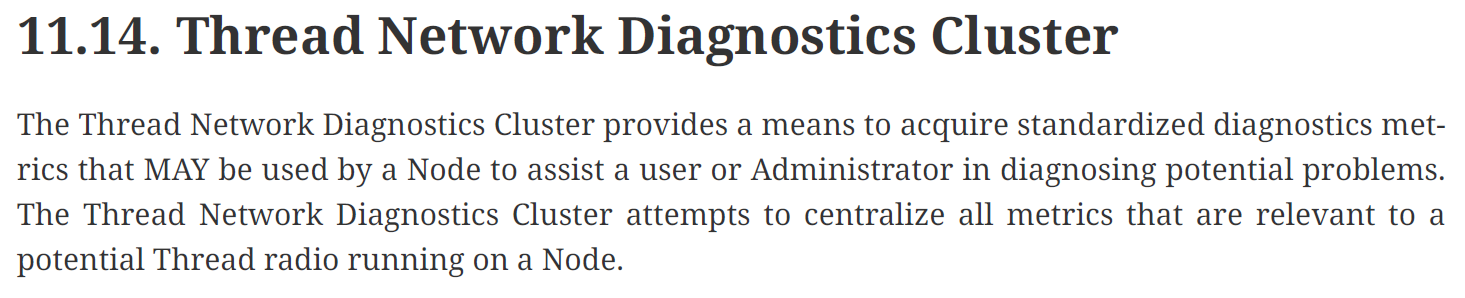
This cluster is part of the Matter Specification and is intended to help diagnose Thread issues. Exactly what I’m trying to do!
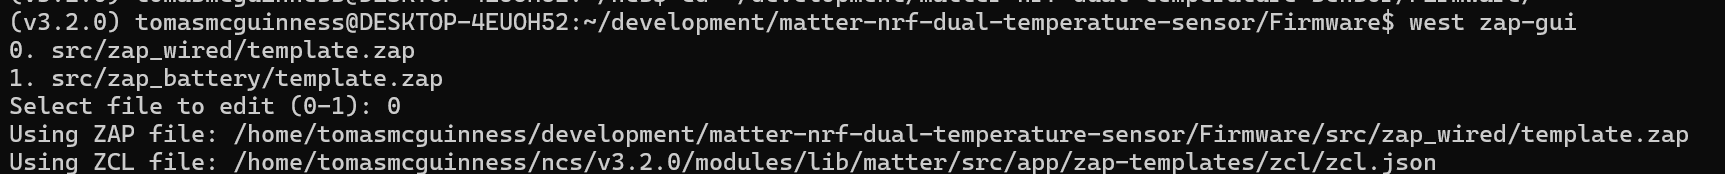
To add this cluster to my firmware, I started with the ZAP tool. This makes it easy to edit the configuration of the device.
west zap-gui
Interestingly, it offered me a choice of ZAP files (wired or battery), which was a nice surprise.
Under the Root Endpoint, I found the Thread Network Diagnostics cluster and turned it on (Server)

Once I’d saved the file, I generated the files
west zap-generate
With the files generated, I compiled the project and flashed it onto a board.
Initial Tests
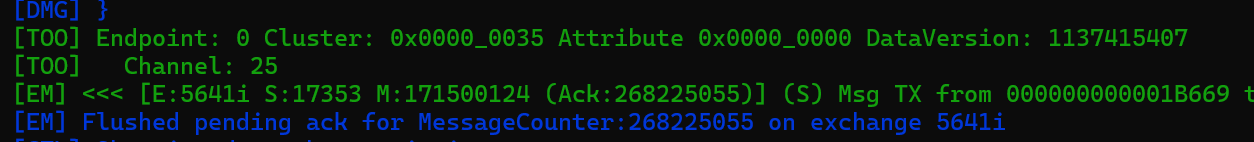
Since I had nothing to actually *read* this cluster, I opted for the trusty chip-tool! I paired my sensor with that and ran my first query to read the device’s Thread address.
chip-tool threadnetworkdiagnostics read ext-address 0x10 0x00
That got a response:

Next, I tried to get the rx-total-count attribute, so see how packets were sent and got an error: UNSUPPORTED_ATTRIBUTE.

Rookie mistake. I hadn’t enabled any of the “Count” features in the cluster. D’oh!
I jumped back to the ZAP tool and turned all the features on.
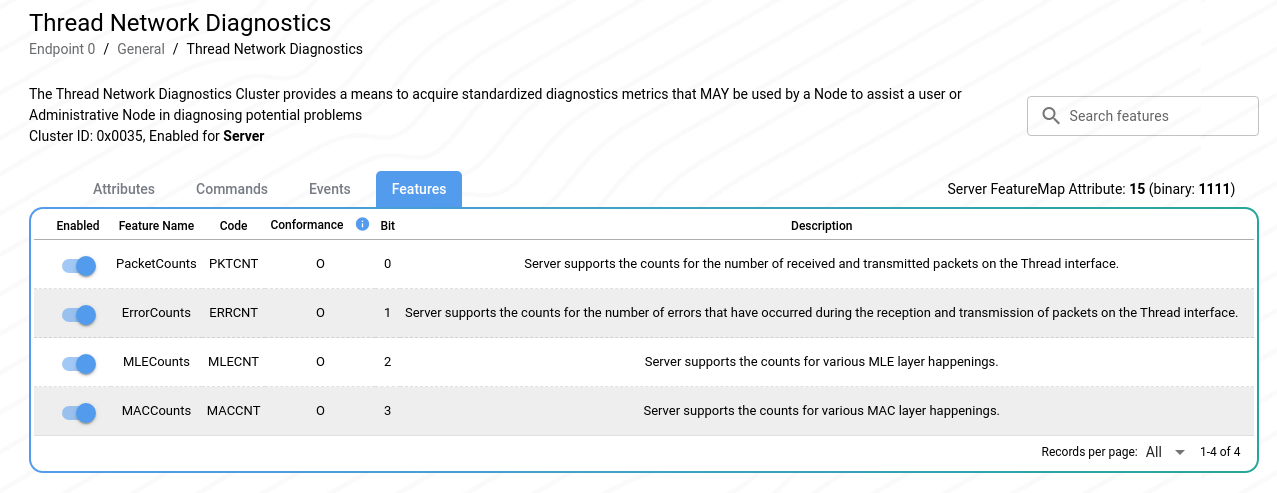
I then enabled all the attributes required by these features, before saving, regenerating and flashing.
I then queried rx-total-count again and received a better answer!

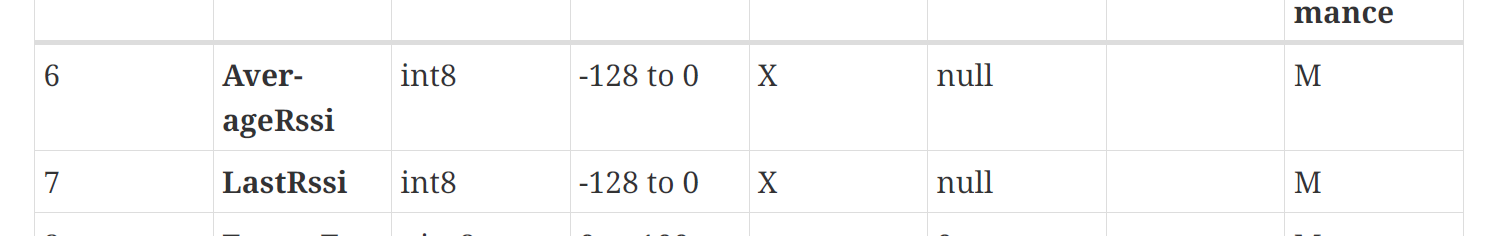
I then tried the neighbor-table attribute. This attribute should provide a list of a Thread device’s neighbours (not the American spelling!).
One of the properties returned from this is the RSSI of the neighbour. This would give an indication of the radio strength.
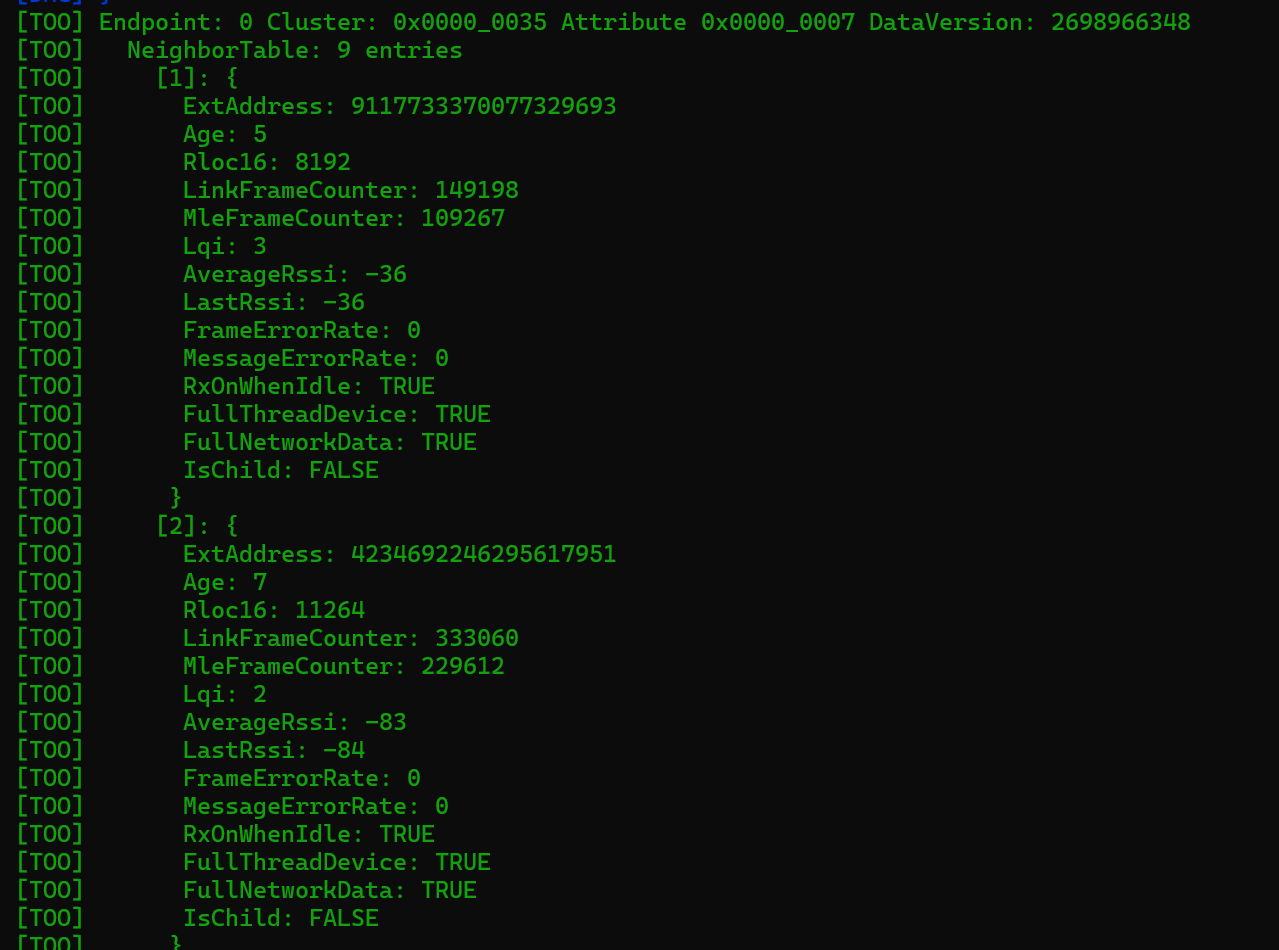
This returned *nine* entries, which surprised me.
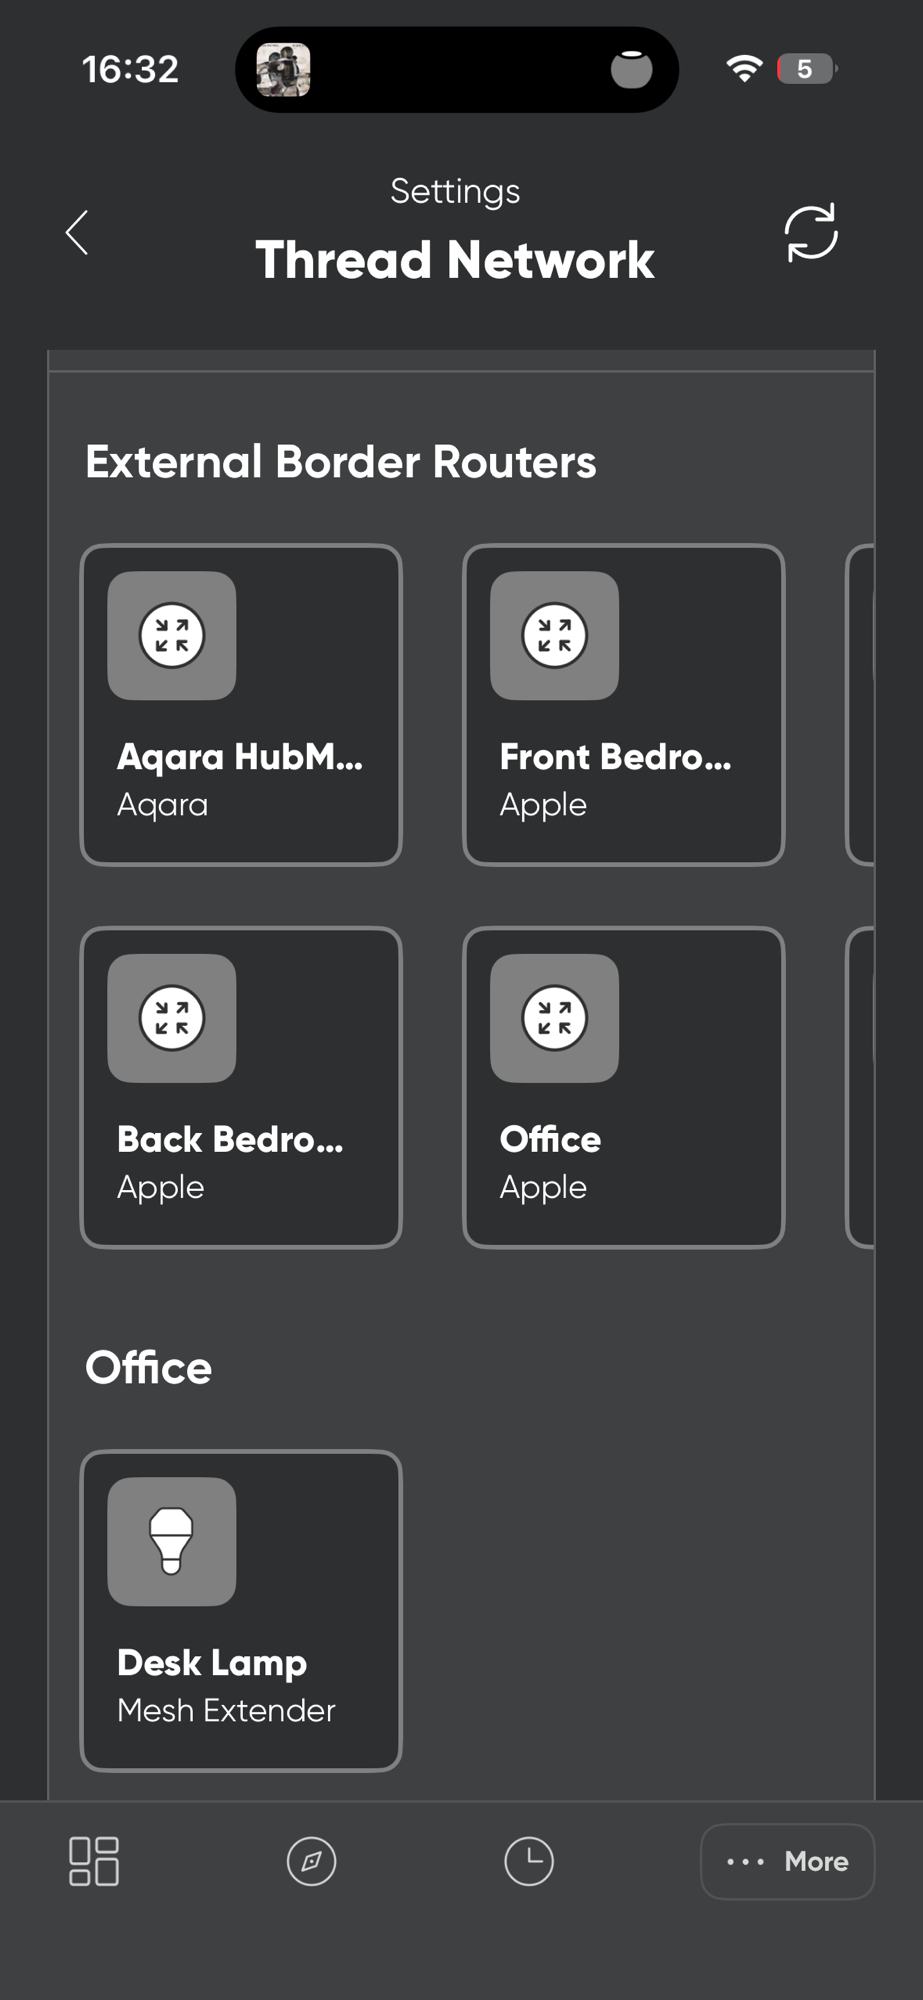
According to the Nanoleaf app, I had 8 devices in my Thread network. Seven border routers and my bulb.
I decided to ignore this discrepancy for now. Stay on Target!
Two of the neighbours had an RSSI of -36 and -33 respectively. As I understand it, the closer to zero, the better the signal, so -36 should be very good. I had a HomePod Mini and the Thread light bulb on my desk, both within fifty centimetres of my device. This explained the strong signal.
With the cluster now working, I continued my tests by moving the sensor to the master bedroom. The Aqara M200 was plugged into a socket in the Bedroom, leaving a 5-metre gap.
Testing in new location
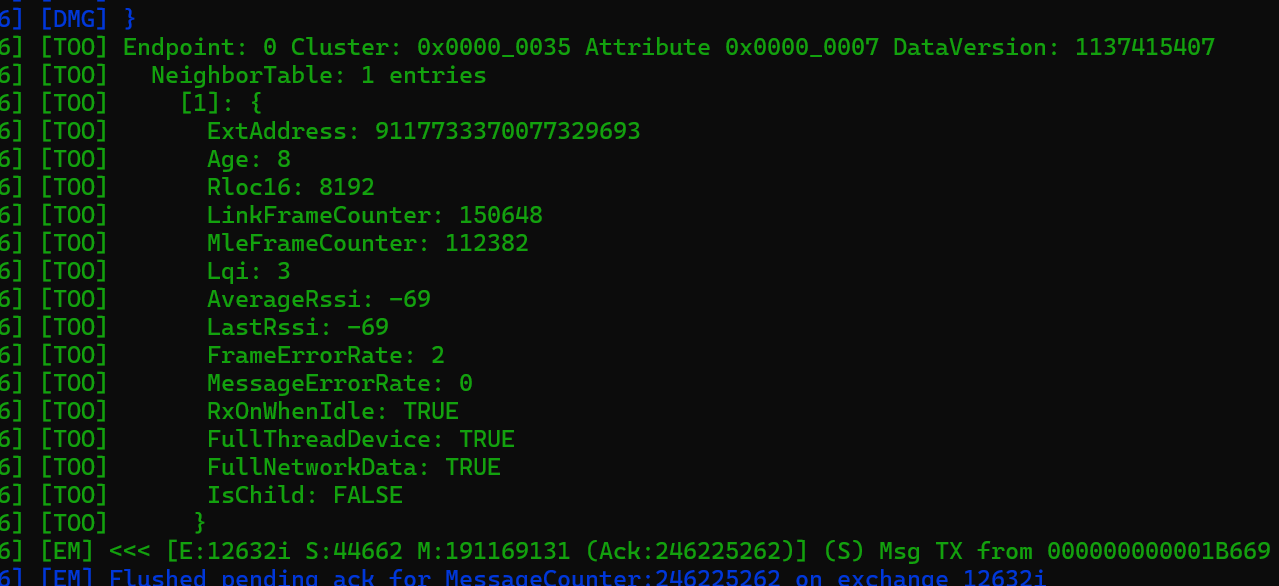
After moving and powering up the device, I tried the same neighbor-table query.
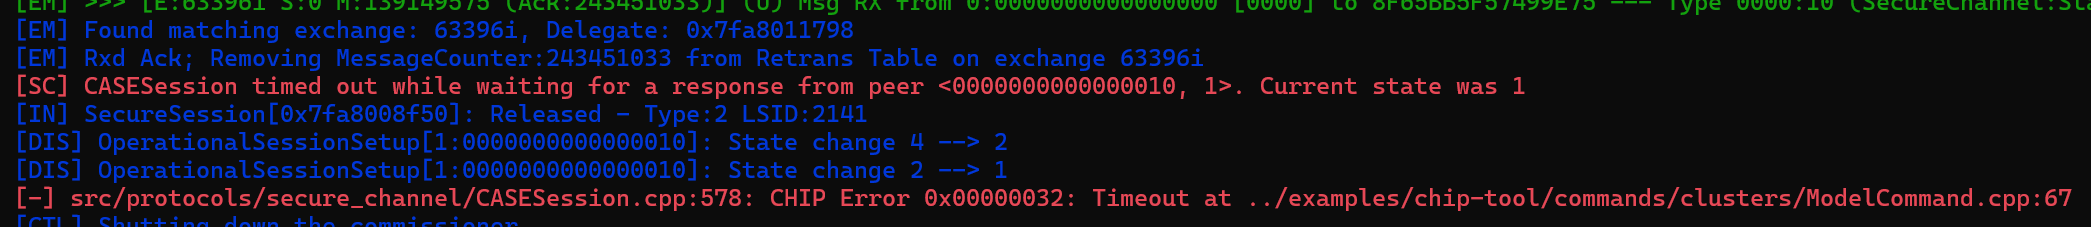
The sensor appeared to be out of range! Same timeout. Perhaps the Thread network connection and it’s corresponding IPv6 address needed time to refresh after the move?
I waited a minute and tried again. This time I got a slightly different result, but still a failure.

On the third try, I got a result!
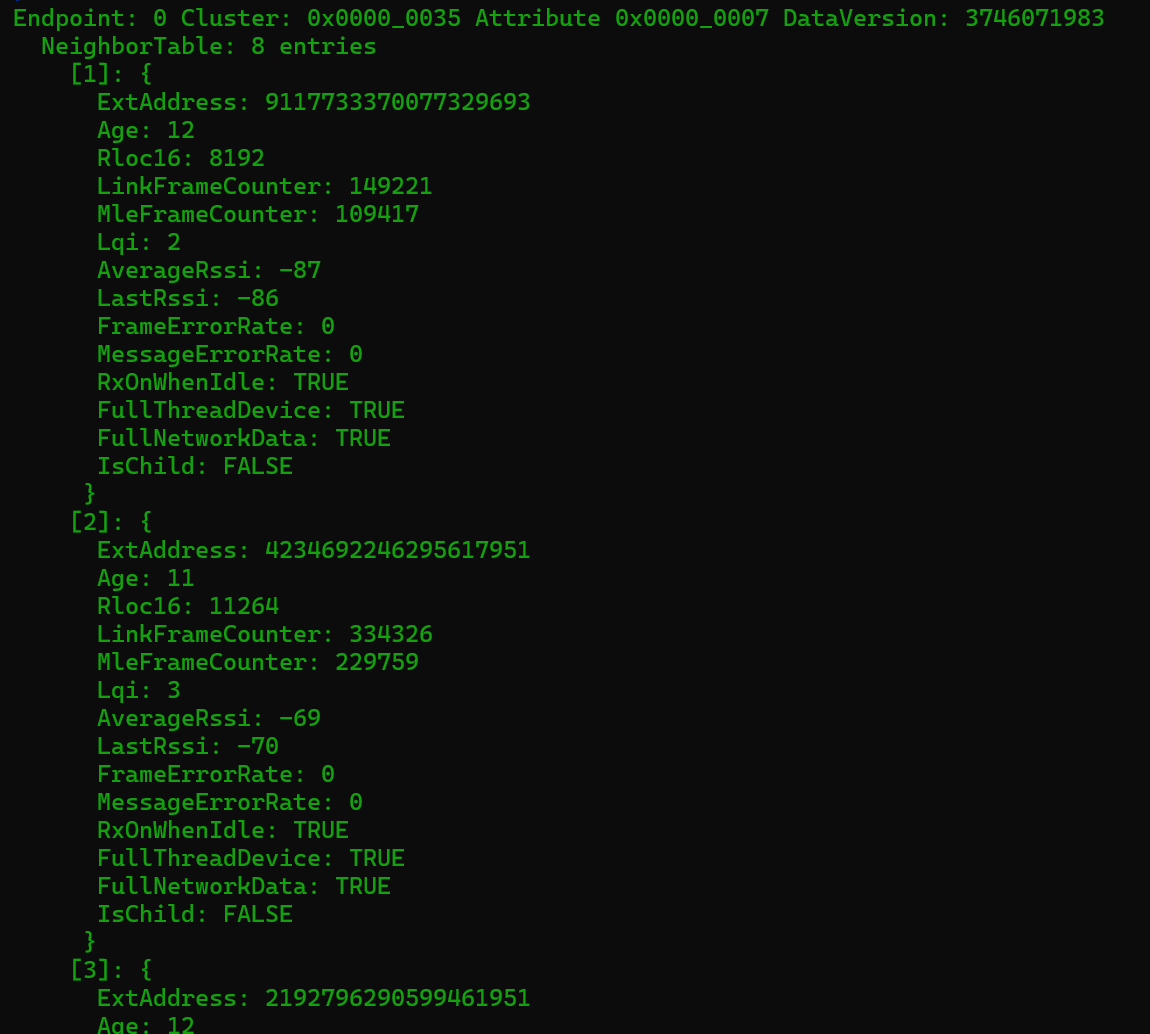
The NeighborTable reported 8 entries. This time the best RSSI was -59. A good reading, which I put down to the proximity of the M200 router.
LQI is the new hotness
Whilst I expected a better value, an RSSI of -60 should be enough for a stable connection. However, after checking with @ludovic9549 on Discord, he suggested turning my attention to the LQI value.
This is the Link Quality Indicator, and it ranges from 0 (the worst) to 255 (the best!).
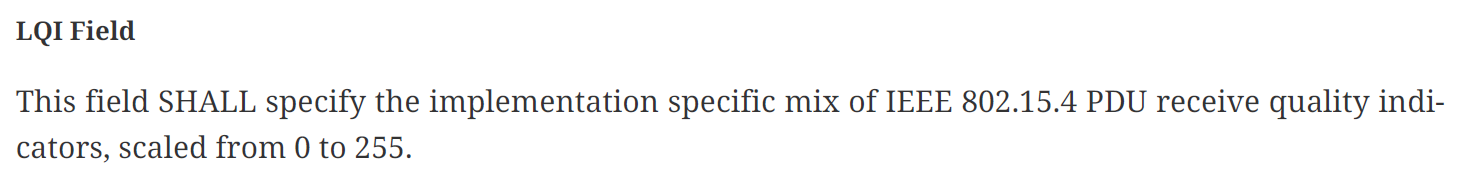
With values between 0 and 3, my LQI was pathetic! I needed to determine why I could have strong signal strength, but such low quality.
Interference?
High RSSI and low LQI could mean the signal is strong, but hard to read.
This means interference may be a possible cause. I have both WiFi and Zigbee in my house and they share the spectrum with Thread.
I use my Unifi networking equipment to run an environment scan
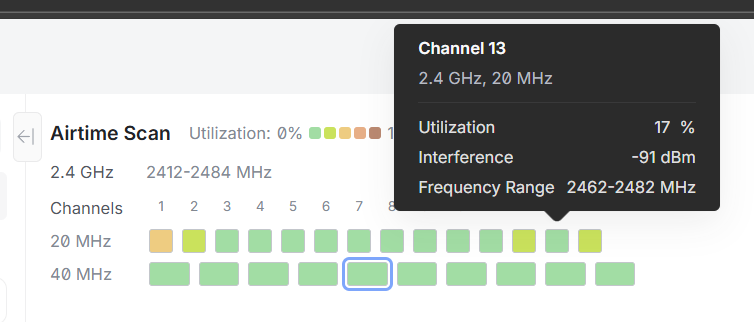
Channel 13 was busy, but it didn’t seem likely to be the culprit.
Comparing with a “real” device
As it didn’t look like radio interference, I needed to rule out my device’s antenna. It was a PCB I designed myself and I’m an absolute amateur in this field!
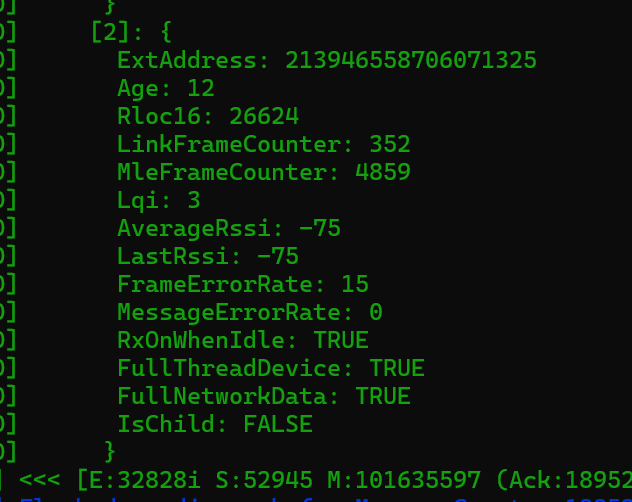
I paired my desk lamp, a NanoLeaf Matter-over-thread bulb with chip-tool, and ran the same request.
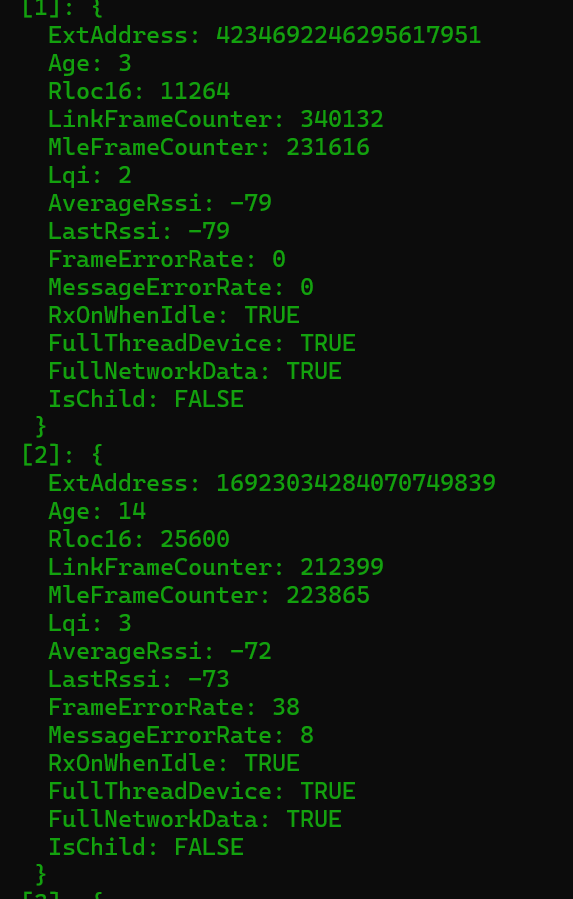
It had the same terrible LQI. I also noticed the FrameErrorRate value, which is a percentage. For some neighbours, like number 2, it was almost 40%. That is a serious amount of packet loss.
If a commercially certified device had similar, rubbish numbers, my device’s antenna probably wasn’t the problem.
So, if it wasn’t RF related, what the hell was causing the terrible connections???
A new Thread network
The one downside to using Apple’s Thread Network is that you have control over it. It’s all managed internally, and you get no opportunity to interfere with it. Like the selected Thread channel for example. You have no way to move it to a different value 🤷🏼♂️
I decided at this stage it would be worth a try with a new, separate Thread Network. I wanted to see if just a single Border Router, running on a better channel, gave similar readings.
As I mentioned in other posts, I had an Open Thread Border Router running on a Raspberry Pi. I needed to use this to create a new Thread Network. To do that, I used the ot-ctl command line tool.
I opened up the control con
sudo ot-ctl
created a new dataset
dataset init new
and checked the details
dataset
which yielded this
Active Timestamp: 1Channel: 25Wake-up Channel: 11Channel Mask: 0x07fff800Ext PAN ID: eb1915c32ec91183Mesh Local Prefix: fd86:541f:df34:f57e::/64Network Key: 305d5e9632aa6d44b5b649d07a924b3bNetwork Name: OpenThread-a6bePAN ID: 0xa6bePSKc: a915d61a1d5621728008e2f91602f25fSecurity Policy: 672 onrc 0
You can see that this dataset indicates Channel 25.
I turned this on, replacing the previous configuration.
dataset commit active
In the Nanoleaf app, a new Thread network appeared!
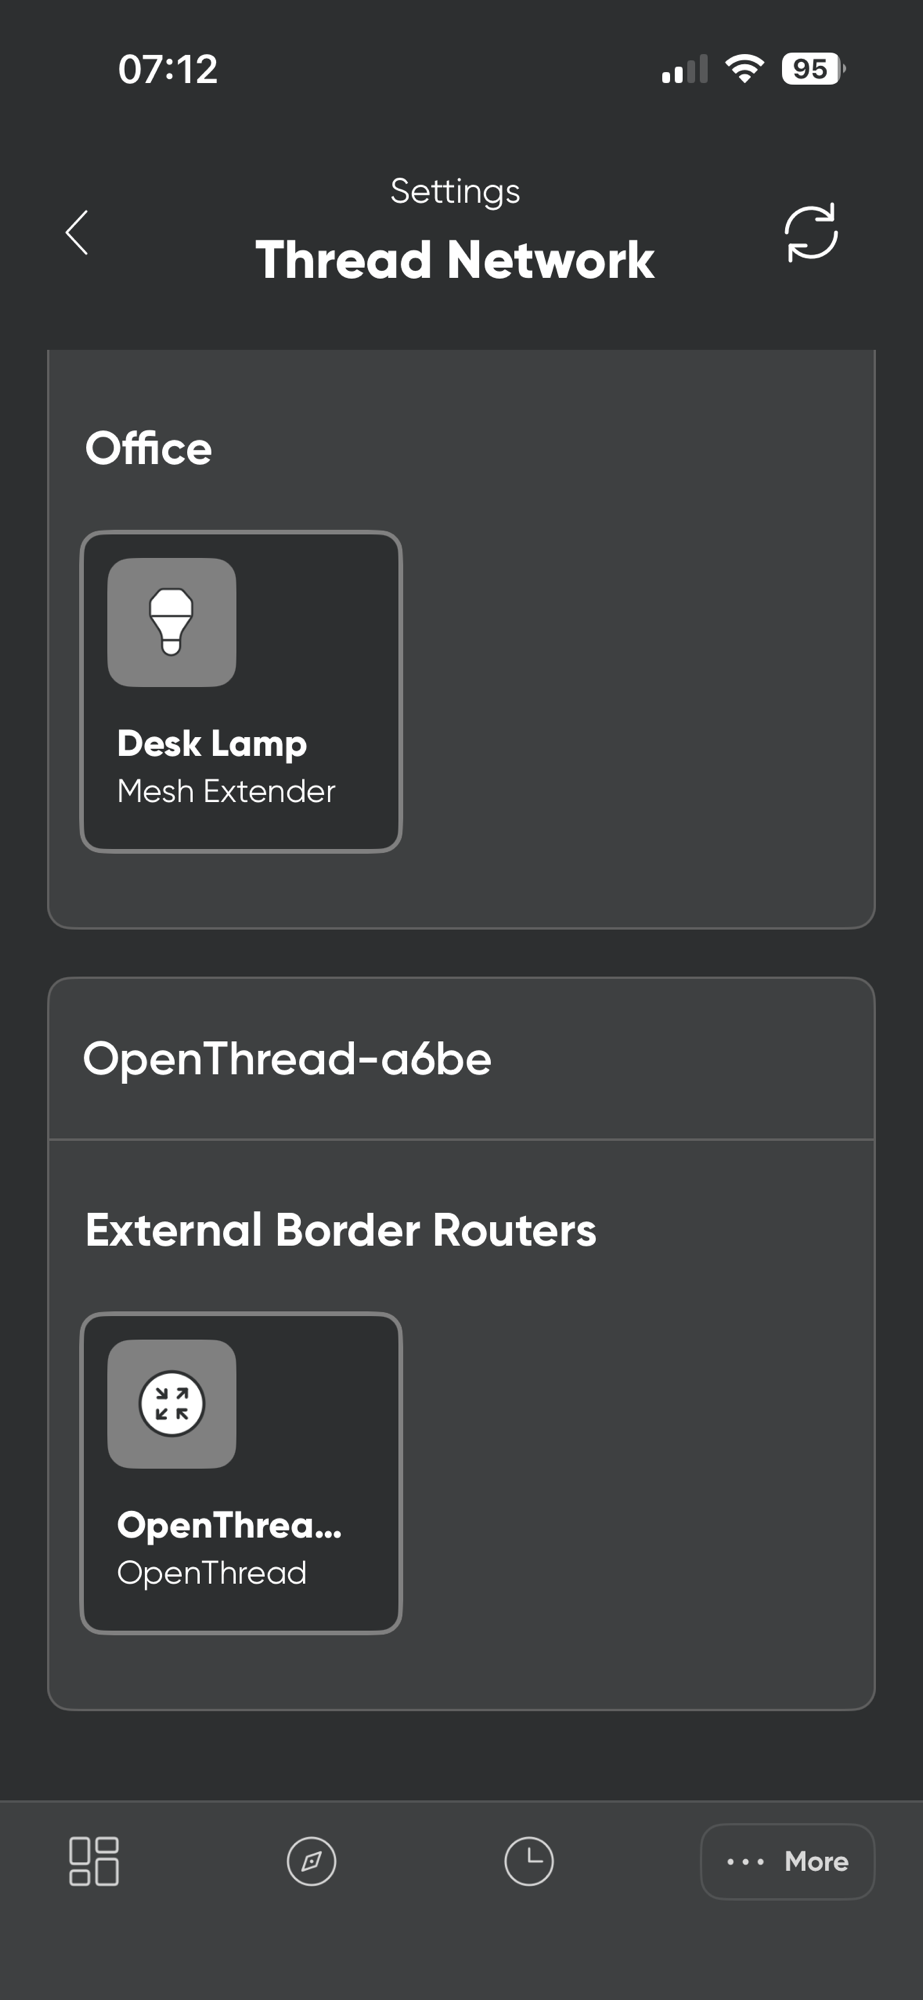
With my network up and active, I needed to move my Nanoleaf bulb onto the new Thread Network. The easiest way would be to commission the bulb again, specifying a different Thread dataset.
I got the dataset for my new Thread network.
dataset active -x
Then I unpaired the bulb from the chip-tool
chip-tool pairing unpair 0x12
I then paired it again, this time using the newer dataset!
chip-tool pairing code-thread 0x12 hex:0e<truncated>f8 2433-073-8328 --bypass-attestation-verifier true
I then checked the Thread channel

It was still 13!
The network name also matched the previous Thread network.

What was going on?!
NetworkCommissioning cluster
The fact that my new Thread Network wasn’t used was a little surprising. In my head, I imagined that the bulb would actually be connected to both networks.
@Greg from discord told me to check the NetworkCommissioning cluster for more information.
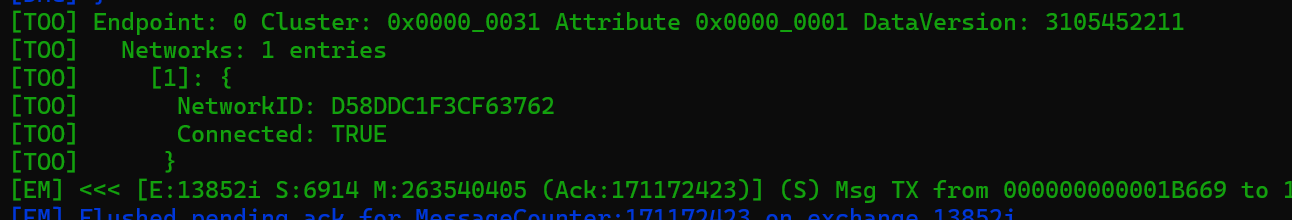
I started by querying the networks that the bulb was connected to
chip-tool networkcommissioning read networks 0x12 0x00
This returned one entry, which I assumed was the first Thread network.
I then checked how many networks my bulb could actually support
chip-tool networkcommissioning read max-networks 0x12 0x00
The answer was one.
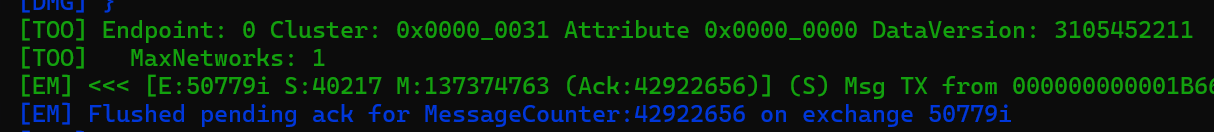
The first Thread network that the device was commissioned into was the only network it could support. The cluster did allow for adding/updating/removing networks, but since I had a limit of one, my hands were tied. I couldn’t add my new network and delete the original one.
I took the nuclear option and simply reset the bulb.
No difference whatsoever!
After I commissioned it again, with the new dataset, the network name and channel returned the expected values.

The NeighborTable now yielded a single entry, 9117733370077329693, which must be the Raspberry Pi Thread Router.
The AverageRSSI was acceptable, but the LQI was still terrible!!! WTF??
Does LQI even work??
The specification said the LQI value would be between 0 and 255. Why was I only sever seeing value between 0 and 3?
When I dig into the SDK code, I found a method called “CalculateLinkQuality” in the OpenThread library.
LinkQuality LinkQualityInfo::CalculateLinkQuality(uint8_t aLinkMargin, uint8_t aLastLinkQuality)
This only seemed to return values 0, 1, 2 or 3! Could this be it?
if (aLinkMargin > threshold3){ linkQuality = kLinkQuality3;}else if (aLinkMargin > threshold2){ linkQuality = kLinkQuality2;}else if (aLinkMargin > threshold1){ linkQuality = kLinkQuality1;}return linkQuality;
A little more digging revealed a LinkQuality enum
enum LinkQuality : uint8_t{ kLinkQuality0 = 0, ///< Link quality 0 (non-existent link) kLinkQuality1 = 1, ///< Link quality 1 kLinkQuality2 = 2, ///< Link quality 2 kLinkQuality3 = 3, ///< Link quality 3};
I asked around on Discord and several users reported that they only ever saw LQI values between 0 and 3!!
That seemed to confirm my findings.
So, a Link Quality of 3 is actually very good?
My assumptions were then confirmed by a user on LinkedIn, who said that 3 was a good score! They even pointed me to the same file in OpenThread.

I read more of the OpenThread code, and it seemed that RSSI is used to determine the Link Quality. This means that a good RSSI would give a good Link Quality score. That seemed contradictory to me.
A strong signal doesn’t mean a clear signal…
When channel 13 is not channel 13!
I then got an interesting comment on Reddit in response to one of my posts on the subject:
From @peterwemm.
Ch.13 is really unfortunate. If you have active wifi nearby then its almost certainly going to get a ton of interference as this is right in the middle of wifi channel 1 with 20MHz width.
I didn’t really understand channels, but some reading revealed the following to me:
- Thread uses channel 11 to 26.
- WiFi uses channel 1 to 13
I looked at my WiFi environment scan again and my Channel 1 was *quite* busy, with utilization at 50%. The adjacent channel 2 was also busy at 40%.
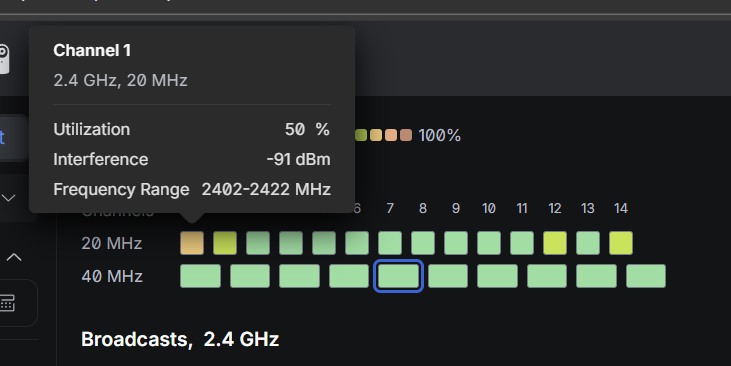
Was interference the reason my existing Thread network was rubbish??
Another Attempt!
To test this, I added my custom Temperature Sensor into the new Thread network.
I queried it’s ext-address (which, I *think* is the Thread address)
chip-tool threadnetworkdiagnostics read ext-address 0x11 0x00
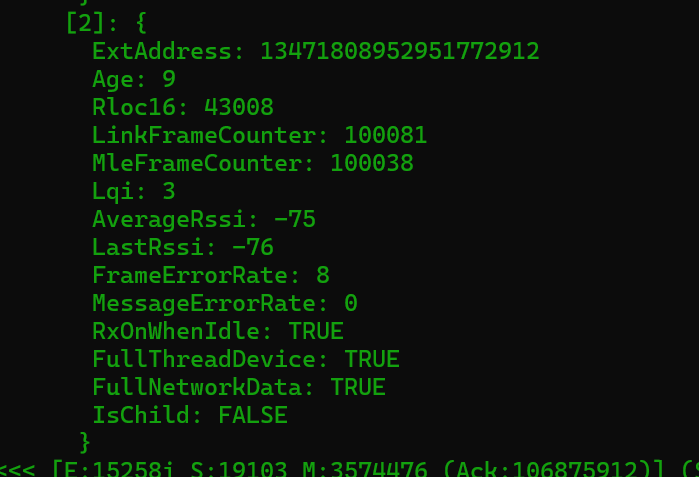
This returned the ExtAddress number 13471808952951772912

I then checked the NeighborTable of my Thread Bulb
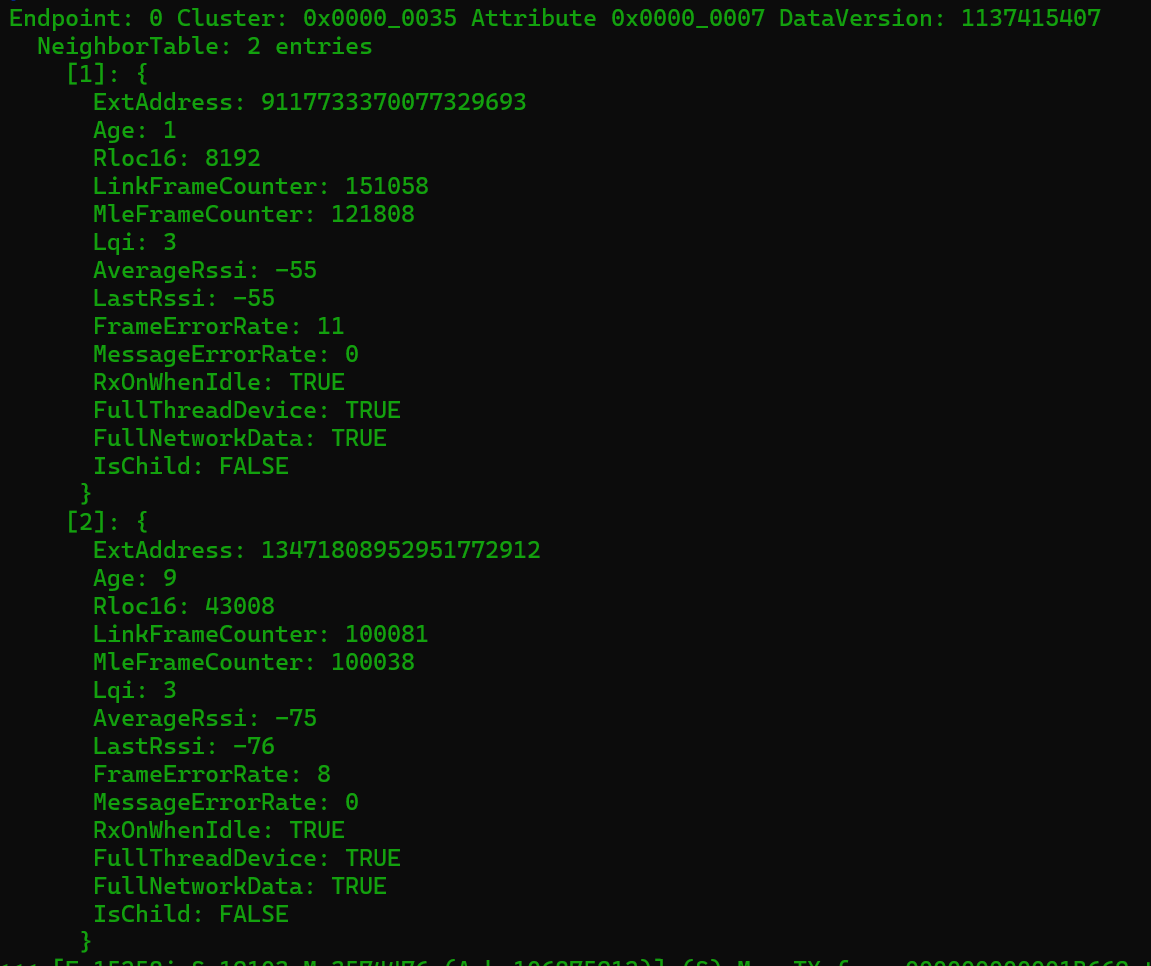
I could now see two neighbours. My Raspberry Pi was still there (911), but a new entry had appeared. This was my device as it had the matching ExtAddress!
A good RSSI, since my PCB was sitting about 15cm away, and an excellent LQI of 3. The FrameErrorRate error was also only 8% (compared to the 40% we’d seen previously)
I then moved the device to the master bedroom. This put it approximately 8-metres away from both my bulb and my Raspberry Pi!
Checking the Thread bulbs’ neighbours, I could see the RSSI from my sensor was -75dBm. Surprisingly good given the distance, two brick walls and a wardrobe of clothes.
But now came the moment of truth, checking the NeighborTable on my sensor, at the opposite corner of my house. I ran the same command…and boom!
The CASE setup was *really* fast and it responded to my command really quickly! Huzzah! The FrameErrorRate was a little higher at 15%, but the connection seemed to be good, with no timeouts.
I then quizzed the sensor’s temperature probe and got back the expected -510 (no probes are connected)

No stability issues. The chip-tool established a connection each and every time, without any hesitation.
Summary
After a lot of experimenting and tinkering, I think I have a handle on my Sensor’s connectivity issues.
In the end, it seems that WiFi interference was the most likely cause of the connectivity issues. I have no idea why my Apple network chose channel 13, given its clash with WiFi. Perhaps my HomePods assumed it was all 5GHz WiFi??
I learned about the Thread Network Diagnostics Cluster and the Network Commissioning cluster, which are useful clusters to know about. I also discovered that my PCB needs more power to ensure solid RF behaviour. Perhaps I can get away with my 2.2V now that my Thread network has less interference?
Once I’ve recommissioned the existing 9 sensors, I’ll be sure to provide an update!
Hopefully you’ve learned something from all this. I know I have and that’s all positive.
Update: 26th Feb 2026
Nordic confirmed that the LQI will only be reported between 0 and 3. This is the OpenThread implementation. Difference Thread implementations could report this value in a different way.
Did you enjoy this post?
If you found this blog post useful and want to say thanks, you’re welcome to buy me a coffee. Better yet, why not subscribe to my Patreon so I can continue making, tinkering and sharing.
Be sure to check out my YouTube Channel too – https://youtube.com/tomasmcguinness
Thanks,
Tom!

Leave a comment