As I continue development of my Zigbee Flow and Return temperature sensor, I’m worried about the stability of my code.
Once I’d finished the code, I deployed it to a nRF52840DK, connected to the mains i.e. on all the time. After the first few days, Home Assistant reported it as unavailable. Clicking Identify did nothing.
There was no response.
This happens if Home Assistant hasn’t received an update from the device in a certain period of time.
I tweaked my code, using more of the ZBOSS scheduler stuff and put the DK to the side. After a few days, the Identify light would turn on and that was it. Temperatures wouldn’t update either. This was an improvement, but still not right.
Finding the problem?
I’m new to ZBOSS and Zigbee programming, so I was 99% sure the issue would be in my own code. Finding it would be tricky.
The behavior I’d seen e.g. the Identify light turning on, but not blinking, pointed to threading/scheduling.

This identify_cb() method is invoked when you request the device identify itself. This uses the ZB_SCHEDULE_APP_CALLBACK to trigger the toggle_identify_led() method.
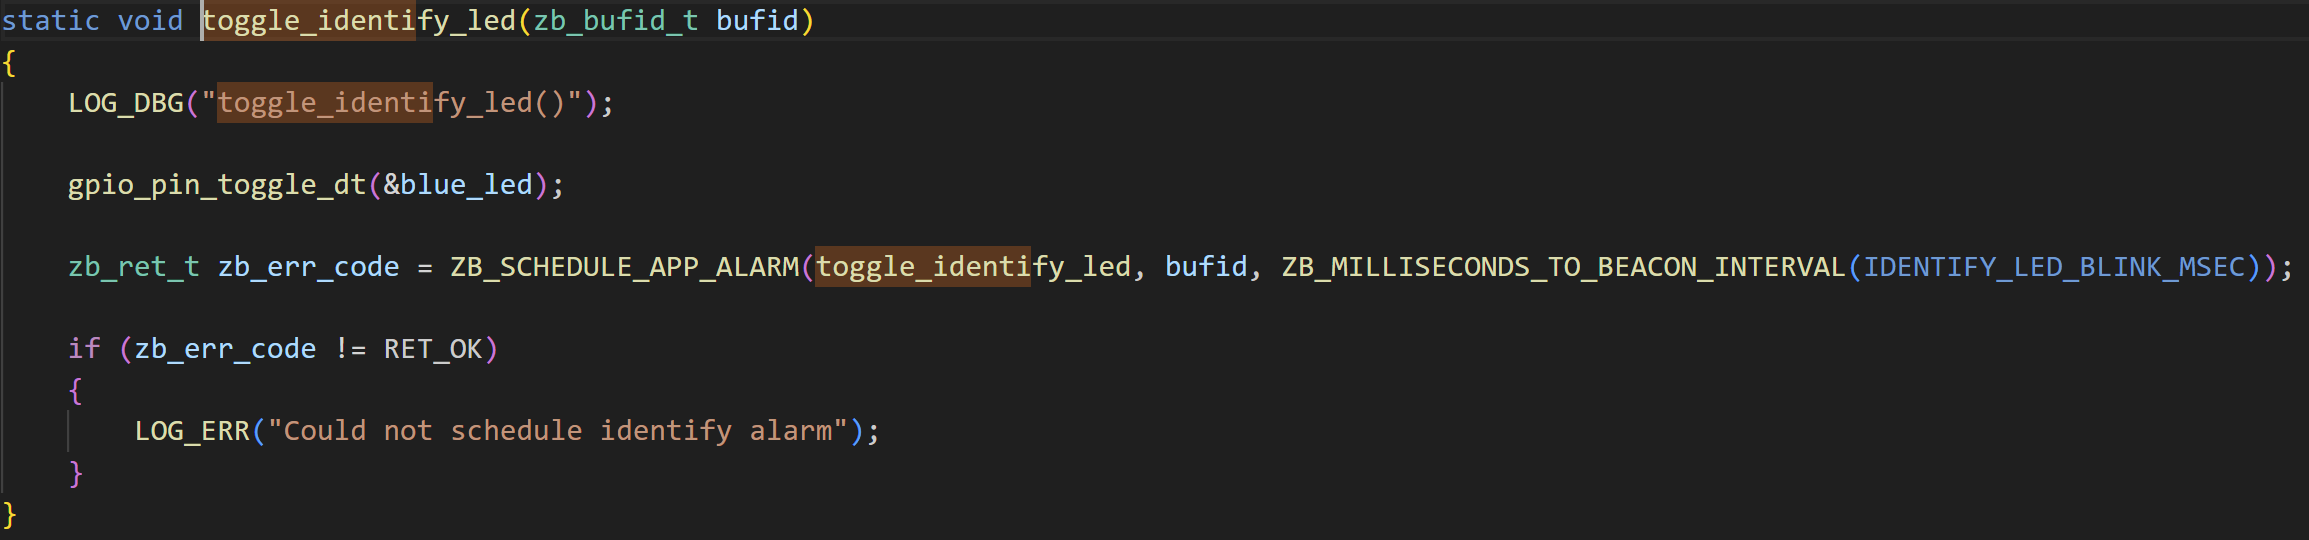
This method then toggles the identify LED and then schedules another call to it in 100ms time. This makes the LED rapidly blink.
The fact the LED turned on and then got suck pointed to the ZB_SCHEDULE_APP_ALARM method not working.
According to the Nordic forums, there is a limit on how many alarms can be scheduled. Perhaps I was scheduling too many???
How to find out?
Logging was the obvious first step!
Each time I used one of the ZB_ methods, I could just log the result. If I found they were failing, I’d have a much better idea of what was going on.
Enabling logging was easy. Capturing the logs proved more difficult!
Up until now, I’d captured the RTT logs using VS Code when the DK was connected to my PC. Doing that long term wasn’t an option as I turn my power-hungry PC off when it’s not in use.
What I needed was a little computer I could run the Segger software on…
Enter the RPi
The Raspberry Pi seemed like an ideal choice! I had one running as an Open Thread Border Router and figured I could expand its duties.
After updating my Pi, I pulled down the ARM version of JLink. You have to jump through a few hoops on the website to get the package. I downloaded the .deb file to my PC and then used scp to copy it across to my RPi.
scp JLink_Linux_V812d_arm64.deb tomasmcguinness@192.168.1.10:~Once copied, I executed the installation
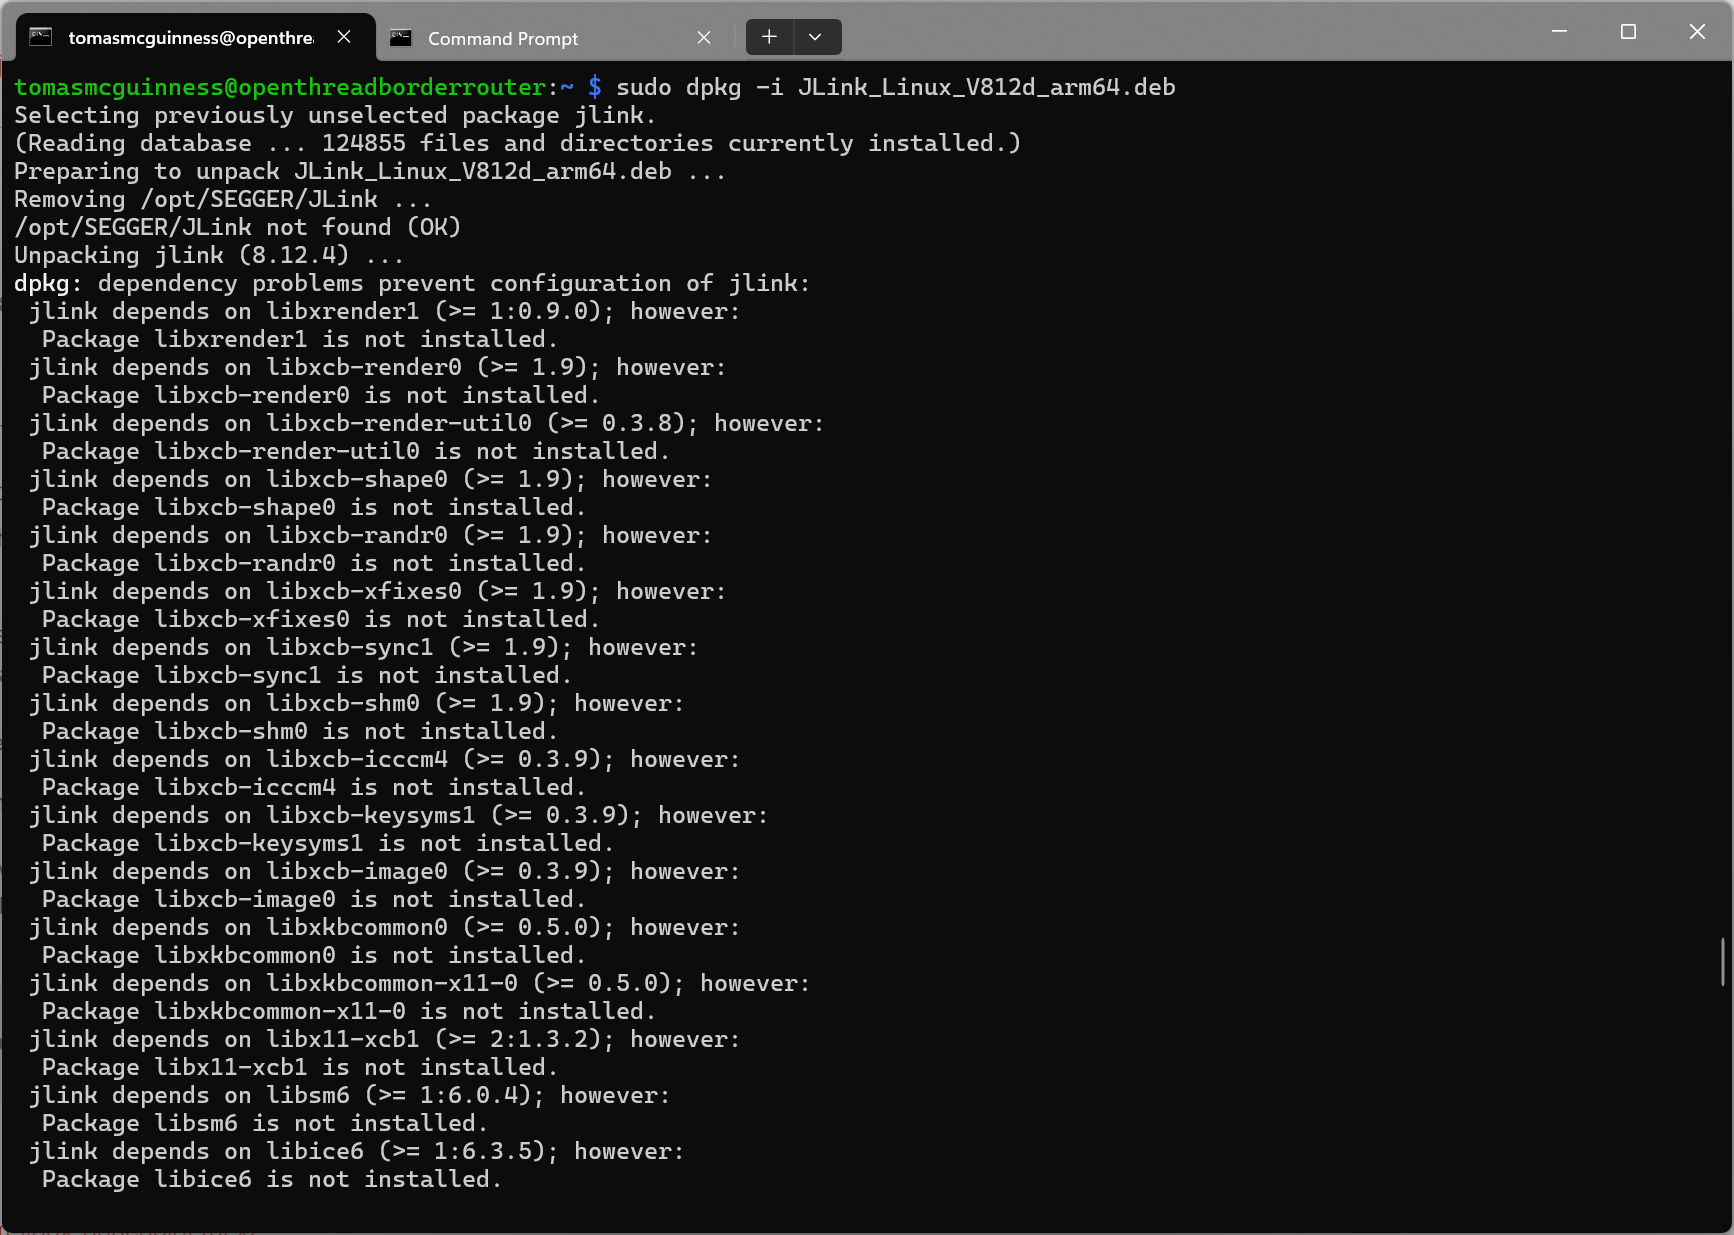
sudo dpkg -i JLink_Linux_V812d_arm64.debIt didn’t go too well!
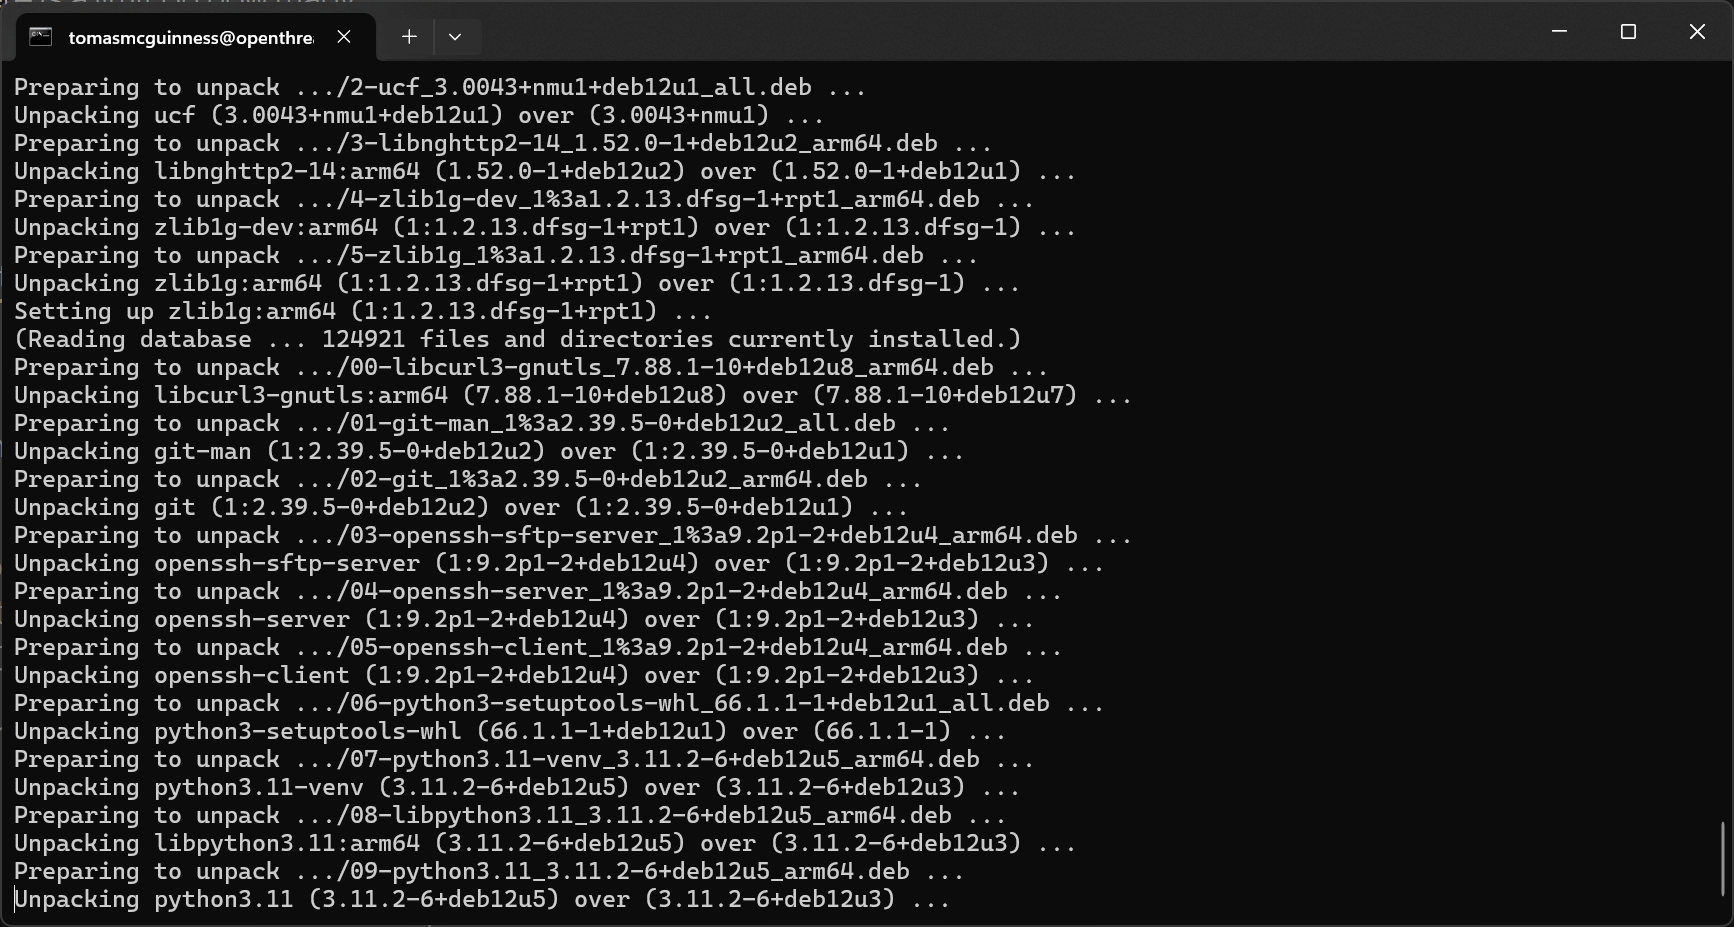
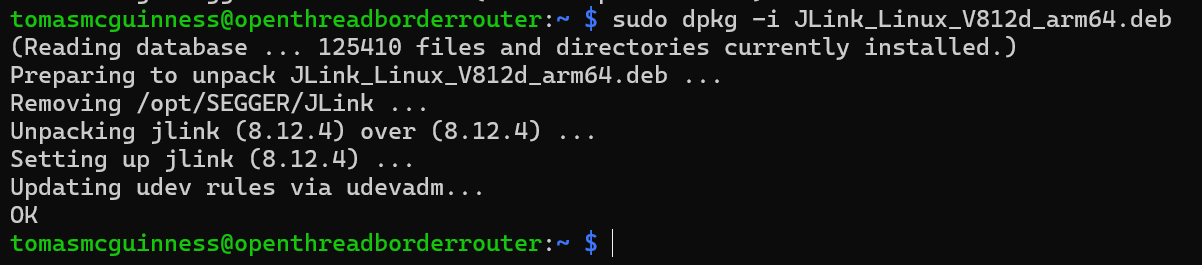
Thankfully, I was able to repair the installation by running this:
sudo apt --fix-broken installI then ran the installation again and it worked nicely!
Connecting to my nRF52840DK
This took a little tinkering and messing around, but I got it working in the end.
/opt/SEGGER/JLink_V812d/JLinkRTTLogger -Device NRF52840_XXAA -If SWD -Speed 4000 -RTTChannel 0 05_02_2025.log-Device tells it what it’s connecting to.
-If is the interface name
-Speed is the transfer speed (I think)
-RTTChannel is 0. Not 100% sure what this is, but 0 worked for me. (You can see in the screenshot it says channel 0 is a Terminal)
05_02_2025.log is the name of the log file.
One it’s started, you should see something like this:
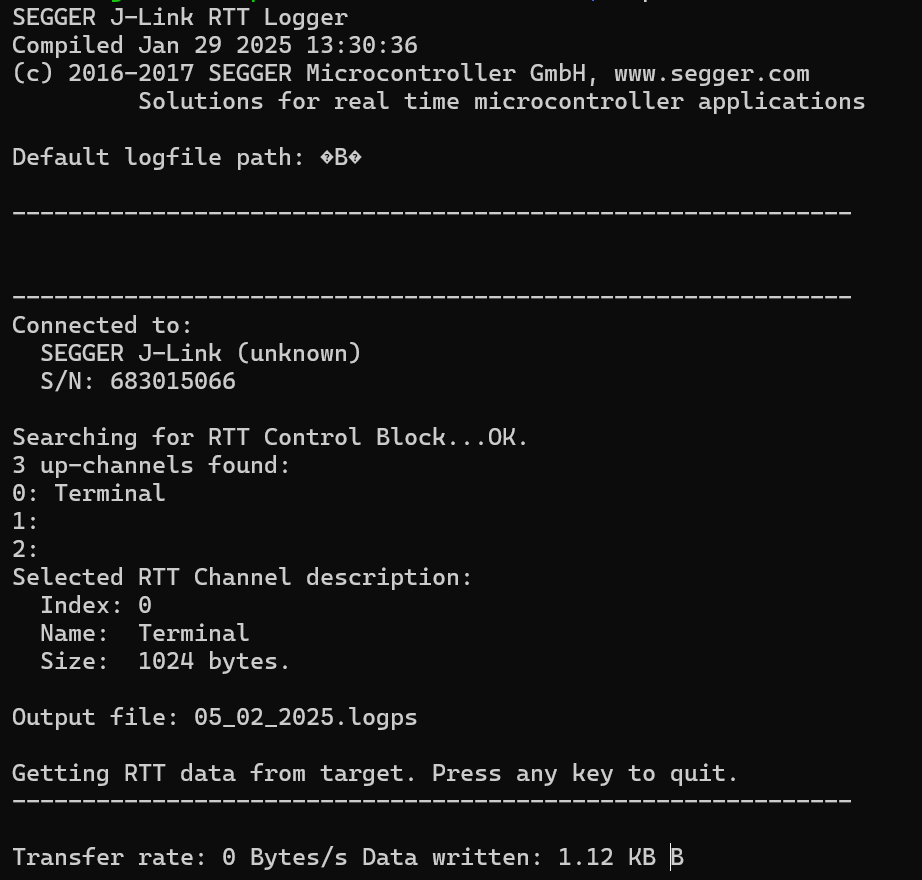
The log file it creates should be growing too.
Running in the background
With the command actually running, the next trick was to keep it running, even after I disconnected the SSH session!
Unfortunately, the JLinkRTTLogger doesn’t seem to support background running. I tried using nohup and screen, but neither worked.
That left me the old-fashioned route. Connecting to the RPi using a keyboard and mouse and an HDMI cable.
Summary
Hopefully that’s been useful.
My RTT Logger is running now and I’ll check the status of my sensor in a few days. If it does stop responding hopefully my logs will give me clue!

Leave a comment